Maltese vs Immigrants from Northern Africa Householder Income Under 25 years

COMPARE

Maltese
Race
Ancestry
AfghanAfricanAlaska NativeAlaskan AthabascanAlbanianAleutAlsatianAmericanApacheArabArapahoArgentineanArmenianAssyrian/Chaldean/SyriacAustralianAustrianBahamianBangladeshiBarbadianBasqueBelgianBelizeanBermudanBhutaneseBlackfeetBolivianBrazilianBritishBritish West IndianBulgarianBurmeseCajunCambodianCanadianCape VerdeanCarpatho RusynCelticCentral AmericanCentral American IndianCherokeeCheyenneChickasawChileanChineseChippewaChoctawColombianColvilleComancheCosta RicanCreeCreekCroatianCrowCubanCypriotCzechCzechoslovakianDanishDelawareDominicanDutchDutch West IndianEastern EuropeanEcuadorianEgyptianEnglishEstonianEthiopianEuropeanFijianFilipinoFinnishFrenchFrench American IndianFrench CanadianGermanGerman RussianGhanaianGreekGuamanian/ChamorroGuatemalanGuyaneseHaitianHmongHonduranHopiHoumaHungarianIcelanderIndian (Asian)IndonesianInupiatIranianIraqiIrishIroquoisIsraeliItalianJamaicanJapaneseJordanianKenyanKiowaKoreanLaotianLatvianLebaneseLiberianLithuanianLumbeeLuxembourgerMacedonianMalaysianMalteseMarshalleseMenomineeMexicanMexican American IndianMongolianMoroccanNative HawaiianNavajoNepaleseNew ZealanderNicaraguanNigerianNorthern EuropeanNorwegianOkinawanOsageOttawaPaiutePakistaniPalestinianPanamanianParaguayanPennsylvania GermanPeruvianPimaPolishPortuguesePotawatomiPuebloPuerto RicanPuget Sound SalishRomanianRussianSalvadoranSamoanScandinavianScotch-IrishScottishSeminoleSenegaleseSerbianShoshoneSierra LeoneanSiouxSlavicSlovakSloveneSomaliSouth AfricanSouth AmericanSouth American IndianSoviet UnionSpaniardSpanishSpanish AmericanSpanish American IndianSri LankanSubsaharan AfricanSudaneseSwedishSwissSyrianTaiwaneseThaiTlingit-HaidaTohono O'OdhamTonganTrinidadian and TobagonianTsimshianTurkishU.S. Virgin IslanderUgandanUkrainianUruguayanUteVenezuelanVietnameseWelshWest IndianYakamaYaquiYugoslavianYumanYup'ikZimbabwean
Immigration
NonimmigrantsImmigrantsAfghanistanAfricaAlbaniaArgentinaArmeniaAsiaAustraliaAustriaBahamasBangladeshBarbadosBelarusBelgiumBelizeBoliviaBosnia and HerzegovinaBrazilBulgariaBurma/MyanmarCabo VerdeCambodiaCameroonCanadaCaribbeanCentral AmericaChileChinaColombiaCongoCosta RicaCroatiaCubaCzechoslovakiaDenmarkDominicaDominican RepublicEastern AfricaEastern AsiaEastern EuropeEcuadorEgyptEl SalvadorEnglandEritreaEthiopiaEuropeFijiFranceGermanyGhanaGreeceGrenadaGuatemalaGuyanaHaitiHondurasHong KongHungaryIndiaIndonesiaIranIraqIrelandIsraelItalyJamaicaJapanJordanKazakhstanKenyaKoreaKuwaitLaosLatin AmericaLatviaLebanonLiberiaLithuaniaMalaysiaMexicoMicronesiaMiddle AfricaMoldovaMoroccoNepalNetherlandsNicaraguaNigeriaNorth AmericaNorth MacedoniaNorthern EuropeNorwayOceaniaPakistanPanamaPeruPhilippinesPolandPortugalRomaniaRussiaSaudi ArabiaScotlandSenegalSerbiaSierra LeoneSingaporeSomaliaSouth AfricaSouth AmericaSouth Central AsiaSouth Eastern AsiaSouthern EuropeSpainSri LankaSt. Vincent and the GrenadinesSudanSwedenSwitzerlandSyriaTaiwanThailandTrinidad and TobagoTurkeyUgandaUkraineUruguayUzbekistanVenezuelaVietnamWest IndiesWestern AfricaWestern AsiaWestern EuropeYemenZaireZimbabweAzores
Immigrants from Northern Africa
Race
Ancestry
AfghanAfricanAlaska NativeAlaskan AthabascanAlbanianAleutAlsatianAmericanApacheArabArapahoArgentineanArmenianAssyrian/Chaldean/SyriacAustralianAustrianBahamianBangladeshiBarbadianBasqueBelgianBelizeanBermudanBhutaneseBlackfeetBolivianBrazilianBritishBritish West IndianBulgarianBurmeseCajunCambodianCanadianCape VerdeanCarpatho RusynCelticCentral AmericanCentral American IndianCherokeeCheyenneChickasawChileanChineseChippewaChoctawColombianColvilleComancheCosta RicanCreeCreekCroatianCrowCubanCypriotCzechCzechoslovakianDanishDelawareDominicanDutchDutch West IndianEastern EuropeanEcuadorianEgyptianEnglishEstonianEthiopianEuropeanFijianFilipinoFinnishFrenchFrench American IndianFrench CanadianGermanGerman RussianGhanaianGreekGuamanian/ChamorroGuatemalanGuyaneseHaitianHmongHonduranHopiHoumaHungarianIcelanderIndian (Asian)IndonesianInupiatIranianIraqiIrishIroquoisIsraeliItalianJamaicanJapaneseJordanianKenyanKiowaKoreanLaotianLatvianLebaneseLiberianLithuanianLumbeeLuxembourgerMacedonianMalaysianMarshalleseMenomineeMexicanMexican American IndianMongolianMoroccanNative HawaiianNavajoNepaleseNew ZealanderNicaraguanNigerianNorthern EuropeanNorwegianOkinawanOsageOttawaPaiutePakistaniPalestinianPanamanianParaguayanPennsylvania GermanPeruvianPimaPolishPortuguesePotawatomiPuebloPuerto RicanPuget Sound SalishRomanianRussianSalvadoranSamoanScandinavianScotch-IrishScottishSeminoleSenegaleseSerbianShoshoneSierra LeoneanSiouxSlavicSlovakSloveneSomaliSouth AfricanSouth AmericanSouth American IndianSoviet UnionSpaniardSpanishSpanish AmericanSpanish American IndianSri LankanSubsaharan AfricanSudaneseSwedishSwissSyrianTaiwaneseThaiTlingit-HaidaTohono O'OdhamTonganTrinidadian and TobagonianTsimshianTurkishU.S. Virgin IslanderUgandanUkrainianUruguayanUteVenezuelanVietnameseWelshWest IndianYakamaYaquiYugoslavianYumanYup'ikZimbabwean
Immigration
NonimmigrantsImmigrantsAfghanistanAfricaAlbaniaArgentinaArmeniaAsiaAustraliaAustriaBahamasBangladeshBarbadosBelarusBelgiumBelizeBoliviaBosnia and HerzegovinaBrazilBulgariaBurma/MyanmarCabo VerdeCambodiaCameroonCanadaCaribbeanCentral AmericaChileChinaColombiaCongoCosta RicaCroatiaCubaCzechoslovakiaDenmarkDominicaDominican RepublicEastern AfricaEastern AsiaEastern EuropeEcuadorEgyptEl SalvadorEnglandEritreaEthiopiaEuropeFijiFranceGermanyGhanaGreeceGrenadaGuatemalaGuyanaHaitiHondurasHong KongHungaryIndiaIndonesiaIranIraqIrelandIsraelItalyJamaicaJapanJordanKazakhstanKenyaKoreaKuwaitLaosLatin AmericaLatviaLebanonLiberiaLithuaniaMalaysiaMexicoMicronesiaMiddle AfricaMoldovaMoroccoNepalNetherlandsNicaraguaNigeriaNorth AmericaNorth MacedoniaNorthern AfricaNorthern EuropeNorwayOceaniaPakistanPanamaPeruPhilippinesPolandPortugalRomaniaRussiaSaudi ArabiaScotlandSenegalSerbiaSierra LeoneSingaporeSomaliaSouth AfricaSouth AmericaSouth Central AsiaSouth Eastern AsiaSouthern EuropeSpainSri LankaSt. Vincent and the GrenadinesSudanSwedenSwitzerlandSyriaTaiwanThailandTrinidad and TobagoTurkeyUgandaUkraineUruguayUzbekistanVenezuelaVietnamWest IndiesWestern AfricaWestern AsiaWestern EuropeYemenZaireZimbabweAzores
Householder Income Under 25 years
Income
Poverty
Unemployment
Labor Participation
Family Structure
Vehicle Availability
Education Level
Disability

Householder Income Under 25 years Comparison

Maltese

Immigrants from Northern Africa

Exceptional
Exceptional
$53,735
HOUSEHOLDER INCOME UNDER 25 YEARS
97.8/ 100
METRIC RATING
108th/ 347
METRIC RANK
$53,185
HOUSEHOLDER INCOME UNDER 25 YEARS
91.9/ 100
METRIC RATING
134th/ 347
METRIC RANK

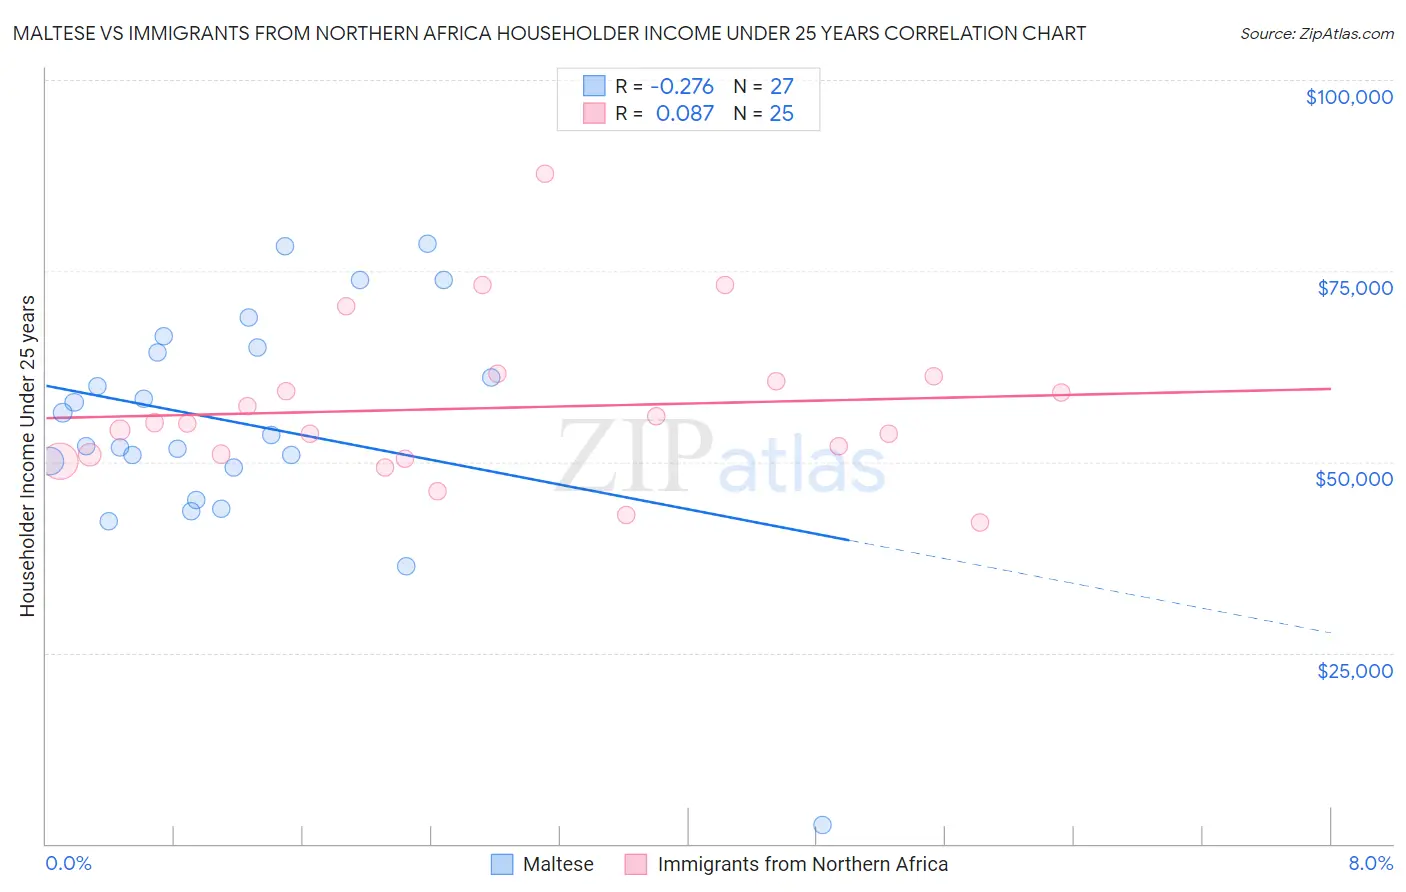
Maltese vs Immigrants from Northern Africa Householder Income Under 25 years Correlation Chart

The statistical analysis conducted on geographies consisting of 112,948,786 people shows a weak negative correlation between the proportion of Maltese and household income with householder under the age of 25 in the United States with a correlation coefficient (R) of -0.276 and weighted average of $53,735. Similarly, the statistical analysis conducted on geographies consisting of 276,331,294 people shows a slight positive correlation between the proportion of Immigrants from Northern Africa and household income with householder under the age of 25 in the United States with a correlation coefficient (R) of 0.087 and weighted average of $53,185, a difference of 1.0%.
Maltese vs Immigrants from Northern Africa Householder Income Under 25 years

Householder Income Under 25 years Correlation Summary

MeasurementMalteseImmigrants from Northern Africa
Minimum$2,499$42,109
Maximum$78,500$87,806
Range$76,001$45,697
Mean$55,048$57,056
Median$53,500$55,032
Interquartile 25% (IQ1)$49,238$50,695
Interquartile 75% (IQ3)$65,046$60,900
Interquartile Range (IQR)$15,807$10,206
Standard Deviation (Sample)$15,373$10,275
Standard Deviation (Population)$15,086$10,068

Similar Demographics by Householder Income Under 25 years

Demographics Similar to Maltese by Householder Income Under 25 years

In terms of householder income under 25 years, the demographic groups most similar to Maltese are Australian ($53,739, a difference of 0.010%), Immigrants from Ecuador ($53,722, a difference of 0.020%), Greek ($53,715, a difference of 0.040%), Immigrants from Colombia ($53,714, a difference of 0.040%), and Immigrants from Oceania ($53,680, a difference of 0.10%).
DemographicsRating | RankHouseholder Income Under 25 years
South Americans
98.6
/100
|
#101
Exceptional
$53,939
Ecuadorians
98.5
/100
|
#102
Exceptional
$53,911
Ukrainians
98.3
/100
|
#103
Exceptional
$53,843
Ethiopians
98.2
/100
|
#104
Exceptional
$53,818
Immigrants | France
98.1
/100
|
#105
Exceptional
$53,805
Albanians
98.1
/100
|
#106
Exceptional
$53,794
Australians
97.8
/100
|
#107
Exceptional
$53,739
Maltese
97.8
/100
|
#108
Exceptional
$53,735
Immigrants | Ecuador
97.7
/100
|
#109
Exceptional
$53,722
Greeks
97.7
/100
|
#110
Exceptional
$53,715
Immigrants | Colombia
97.7
/100
|
#111
Exceptional
$53,714
Immigrants | Oceania
97.5
/100
|
#112
Exceptional
$53,680
Romanians
97.2
/100
|
#113
Exceptional
$53,632
Immigrants | Sweden
97.1
/100
|
#114
Exceptional
$53,621
Immigrants | Albania
96.9
/100
|
#115
Exceptional
$53,597

Demographics Similar to Immigrants from Northern Africa by Householder Income Under 25 years

In terms of householder income under 25 years, the demographic groups most similar to Immigrants from Northern Africa are Chilean ($53,185, a difference of 0.0%), Armenian ($53,179, a difference of 0.010%), Immigrants ($53,201, a difference of 0.030%), Immigrants from Barbados ($53,163, a difference of 0.040%), and Norwegian ($53,127, a difference of 0.11%).
DemographicsRating | RankHouseholder Income Under 25 years
Immigrants | North America
93.9
/100
|
#127
Exceptional
$53,307
Immigrants | Bulgaria
93.9
/100
|
#128
Exceptional
$53,305
New Zealanders
93.7
/100
|
#129
Exceptional
$53,294
Nicaraguans
93.4
/100
|
#130
Exceptional
$53,275
Immigrants | Nicaragua
93.3
/100
|
#131
Exceptional
$53,266
Moroccans
93.1
/100
|
#132
Exceptional
$53,256
Immigrants | Immigrants
92.2
/100
|
#133
Exceptional
$53,201
Immigrants | Northern Africa
91.9
/100
|
#134
Exceptional
$53,185
Chileans
91.9
/100
|
#135
Exceptional
$53,185
Armenians
91.8
/100
|
#136
Exceptional
$53,179
Immigrants | Barbados
91.5
/100
|
#137
Exceptional
$53,163
Norwegians
90.8
/100
|
#138
Exceptional
$53,127
Costa Ricans
90.4
/100
|
#139
Exceptional
$53,106
Hawaiians
89.8
/100
|
#140
Excellent
$53,078
Danes
88.9
/100
|
#141
Excellent
$53,041