Maltese vs Alaska Native Median Family Income
COMPARE
Maltese
Alaska Native
Median Family Income
Median Family Income Comparison
Maltese
Alaska Natives
$115,862
MEDIAN FAMILY INCOME
99.9/ 100
METRIC RATING
52nd/ 347
METRIC RANK
$95,573
MEDIAN FAMILY INCOME
2.6/ 100
METRIC RATING
227th/ 347
METRIC RANK
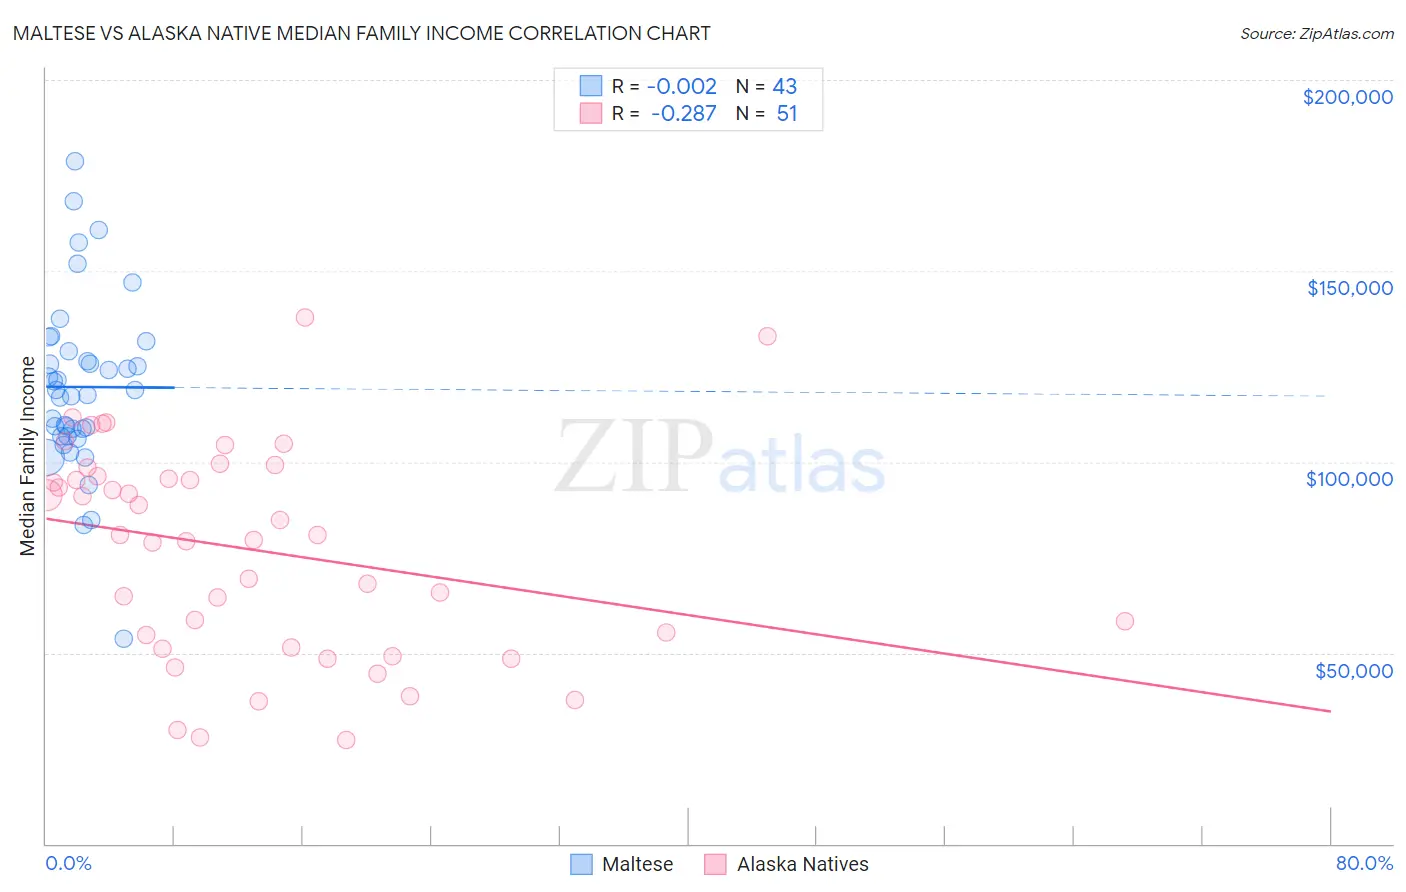
Maltese vs Alaska Native Median Family Income Correlation Chart
The statistical analysis conducted on geographies consisting of 126,250,272 people shows no correlation between the proportion of Maltese and median family income in the United States with a correlation coefficient (R) of -0.002 and weighted average of $115,862. Similarly, the statistical analysis conducted on geographies consisting of 76,737,851 people shows a weak negative correlation between the proportion of Alaska Natives and median family income in the United States with a correlation coefficient (R) of -0.287 and weighted average of $95,573, a difference of 21.2%.
Median Family Income Correlation Summary
| Measurement | Maltese | Alaska Native |
| Minimum | $53,672 | $27,083 |
| Maximum | $178,781 | $137,917 |
| Range | $125,109 | $110,834 |
| Mean | $119,621 | $77,054 |
| Median | $118,717 | $80,833 |
| Interquartile 25% (IQ1) | $106,808 | $51,316 |
| Interquartile 75% (IQ3) | $128,909 | $96,369 |
| Interquartile Range (IQR) | $22,102 | $45,053 |
| Standard Deviation (Sample) | $22,839 | $27,527 |
| Standard Deviation (Population) | $22,571 | $27,256 |
Similar Demographics by Median Family Income
Demographics Similar to Maltese by Median Family Income
In terms of median family income, the demographic groups most similar to Maltese are Immigrants from Malaysia ($115,880, a difference of 0.010%), Immigrants from Norway ($115,847, a difference of 0.010%), Immigrants from Czechoslovakia ($116,165, a difference of 0.26%), Chinese ($116,188, a difference of 0.28%), and Immigrants from Europe ($115,523, a difference of 0.29%).
| Demographics | Rating | Rank | Median Family Income |
| Immigrants | Greece | 99.9 /100 | #45 | Exceptional $117,344 |
| Immigrants | Russia | 99.9 /100 | #46 | Exceptional $116,942 |
| Immigrants | Austria | 99.9 /100 | #47 | Exceptional $116,830 |
| Immigrants | South Africa | 99.9 /100 | #48 | Exceptional $116,286 |
| Chinese | 99.9 /100 | #49 | Exceptional $116,188 |
| Immigrants | Czechoslovakia | 99.9 /100 | #50 | Exceptional $116,165 |
| Immigrants | Malaysia | 99.9 /100 | #51 | Exceptional $115,880 |
| Maltese | 99.9 /100 | #52 | Exceptional $115,862 |
| Immigrants | Norway | 99.9 /100 | #53 | Exceptional $115,847 |
| Immigrants | Europe | 99.9 /100 | #54 | Exceptional $115,523 |
| Lithuanians | 99.8 /100 | #55 | Exceptional $115,395 |
| New Zealanders | 99.8 /100 | #56 | Exceptional $115,230 |
| Greeks | 99.8 /100 | #57 | Exceptional $115,192 |
| Immigrants | Indonesia | 99.8 /100 | #58 | Exceptional $115,162 |
| Immigrants | Netherlands | 99.8 /100 | #59 | Exceptional $114,987 |
Demographics Similar to Alaska Natives by Median Family Income
In terms of median family income, the demographic groups most similar to Alaska Natives are Immigrants from Panama ($95,647, a difference of 0.080%), Immigrants from the Azores ($95,402, a difference of 0.18%), Marshallese ($95,293, a difference of 0.29%), Malaysian ($95,230, a difference of 0.36%), and Ecuadorian ($95,114, a difference of 0.48%).
| Demographics | Rating | Rank | Median Family Income |
| Sudanese | 4.7 /100 | #220 | Tragic $96,783 |
| Immigrants | Ghana | 4.2 /100 | #221 | Tragic $96,544 |
| Immigrants | Nigeria | 4.0 /100 | #222 | Tragic $96,439 |
| Venezuelans | 3.7 /100 | #223 | Tragic $96,281 |
| Immigrants | Nonimmigrants | 3.6 /100 | #224 | Tragic $96,231 |
| Vietnamese | 3.4 /100 | #225 | Tragic $96,123 |
| Immigrants | Panama | 2.7 /100 | #226 | Tragic $95,647 |
| Alaska Natives | 2.6 /100 | #227 | Tragic $95,573 |
| Immigrants | Azores | 2.4 /100 | #228 | Tragic $95,402 |
| Marshallese | 2.2 /100 | #229 | Tragic $95,293 |
| Malaysians | 2.2 /100 | #230 | Tragic $95,230 |
| Ecuadorians | 2.1 /100 | #231 | Tragic $95,114 |
| Immigrants | Venezuela | 1.9 /100 | #232 | Tragic $94,904 |
| Immigrants | Bangladesh | 1.6 /100 | #233 | Tragic $94,665 |
| Immigrants | Western Africa | 1.6 /100 | #234 | Tragic $94,638 |