Malaysian vs Immigrants from Bulgaria Per Capita Income
COMPARE
Malaysian
Immigrants from Bulgaria
Per Capita Income
Per Capita Income Comparison
Malaysians
Immigrants from Bulgaria
$39,194
PER CAPITA INCOME
0.7/ 100
METRIC RATING
259th/ 347
METRIC RANK
$49,482
PER CAPITA INCOME
99.9/ 100
METRIC RATING
66th/ 347
METRIC RANK
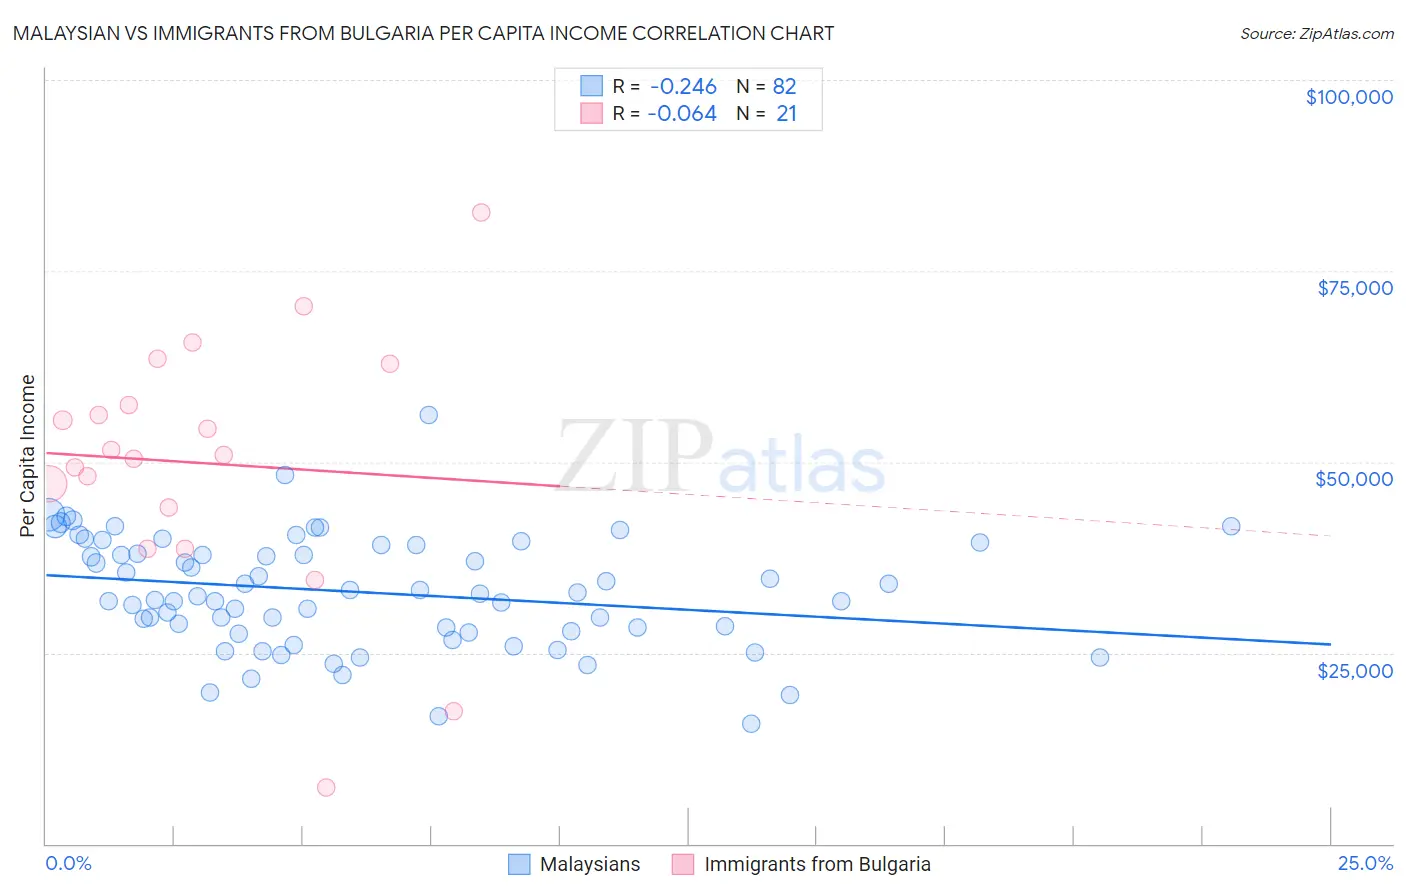
Malaysian vs Immigrants from Bulgaria Per Capita Income Correlation Chart
The statistical analysis conducted on geographies consisting of 226,115,655 people shows a weak negative correlation between the proportion of Malaysians and per capita income in the United States with a correlation coefficient (R) of -0.246 and weighted average of $39,194. Similarly, the statistical analysis conducted on geographies consisting of 172,552,113 people shows a slight negative correlation between the proportion of Immigrants from Bulgaria and per capita income in the United States with a correlation coefficient (R) of -0.064 and weighted average of $49,482, a difference of 26.3%.
Per Capita Income Correlation Summary
| Measurement | Malaysian | Immigrants from Bulgaria |
| Minimum | $15,753 | $7,295 |
| Maximum | $56,163 | $82,704 |
| Range | $40,410 | $75,409 |
| Mean | $32,947 | $49,825 |
| Median | $32,625 | $50,915 |
| Interquartile 25% (IQ1) | $27,821 | $41,288 |
| Interquartile 75% (IQ3) | $39,160 | $60,205 |
| Interquartile Range (IQR) | $11,339 | $18,917 |
| Standard Deviation (Sample) | $7,360 | $16,836 |
| Standard Deviation (Population) | $7,315 | $16,430 |
Similar Demographics by Per Capita Income
Demographics Similar to Malaysians by Per Capita Income
In terms of per capita income, the demographic groups most similar to Malaysians are Alaskan Athabascan ($39,163, a difference of 0.080%), Jamaican ($39,231, a difference of 0.090%), Marshallese ($39,108, a difference of 0.22%), Iroquois ($39,104, a difference of 0.23%), and Belizean ($39,097, a difference of 0.25%).
| Demographics | Rating | Rank | Per Capita Income |
| Immigrants | Azores | 1.0 /100 | #252 | Tragic $39,608 |
| Osage | 1.0 /100 | #253 | Tragic $39,568 |
| Alaska Natives | 1.0 /100 | #254 | Tragic $39,558 |
| Immigrants | Middle Africa | 1.0 /100 | #255 | Tragic $39,529 |
| Hawaiians | 0.8 /100 | #256 | Tragic $39,403 |
| Nicaraguans | 0.8 /100 | #257 | Tragic $39,372 |
| Jamaicans | 0.7 /100 | #258 | Tragic $39,231 |
| Malaysians | 0.7 /100 | #259 | Tragic $39,194 |
| Alaskan Athabascans | 0.6 /100 | #260 | Tragic $39,163 |
| Marshallese | 0.6 /100 | #261 | Tragic $39,108 |
| Iroquois | 0.6 /100 | #262 | Tragic $39,104 |
| Belizeans | 0.6 /100 | #263 | Tragic $39,097 |
| Americans | 0.6 /100 | #264 | Tragic $39,039 |
| Spanish Americans | 0.5 /100 | #265 | Tragic $39,012 |
| Salvadorans | 0.5 /100 | #266 | Tragic $38,858 |
Demographics Similar to Immigrants from Bulgaria by Per Capita Income
In terms of per capita income, the demographic groups most similar to Immigrants from Bulgaria are Immigrants from Romania ($49,463, a difference of 0.040%), Lithuanian ($49,448, a difference of 0.070%), Bolivian ($49,526, a difference of 0.090%), Immigrants from Canada ($49,412, a difference of 0.14%), and Immigrants from Argentina ($49,627, a difference of 0.29%).
| Demographics | Rating | Rank | Per Capita Income |
| Bhutanese | 99.9 /100 | #59 | Exceptional $49,894 |
| Immigrants | Scotland | 99.9 /100 | #60 | Exceptional $49,893 |
| Argentineans | 99.9 /100 | #61 | Exceptional $49,862 |
| Immigrants | Asia | 99.9 /100 | #62 | Exceptional $49,741 |
| Maltese | 99.9 /100 | #63 | Exceptional $49,640 |
| Immigrants | Argentina | 99.9 /100 | #64 | Exceptional $49,627 |
| Bolivians | 99.9 /100 | #65 | Exceptional $49,526 |
| Immigrants | Bulgaria | 99.9 /100 | #66 | Exceptional $49,482 |
| Immigrants | Romania | 99.9 /100 | #67 | Exceptional $49,463 |
| Lithuanians | 99.8 /100 | #68 | Exceptional $49,448 |
| Immigrants | Canada | 99.8 /100 | #69 | Exceptional $49,412 |
| Immigrants | Eastern Europe | 99.8 /100 | #70 | Exceptional $49,316 |
| Greeks | 99.8 /100 | #71 | Exceptional $49,309 |
| Immigrants | Hungary | 99.8 /100 | #72 | Exceptional $49,303 |
| Immigrants | North America | 99.8 /100 | #73 | Exceptional $49,302 |