Lumbee vs Immigrants from Sri Lanka Householder Income Ages 25 - 44 years
COMPARE
Lumbee
Immigrants from Sri Lanka
Householder Income Ages 25 - 44 years
Householder Income Ages 25 - 44 years Comparison
Lumbee
Immigrants from Sri Lanka
$60,305
HOUSEHOLDER INCOME AGES 25 - 44 YEARS
0.0/ 100
METRIC RATING
347th/ 347
METRIC RANK
$109,741
HOUSEHOLDER INCOME AGES 25 - 44 YEARS
100.0/ 100
METRIC RATING
32nd/ 347
METRIC RANK
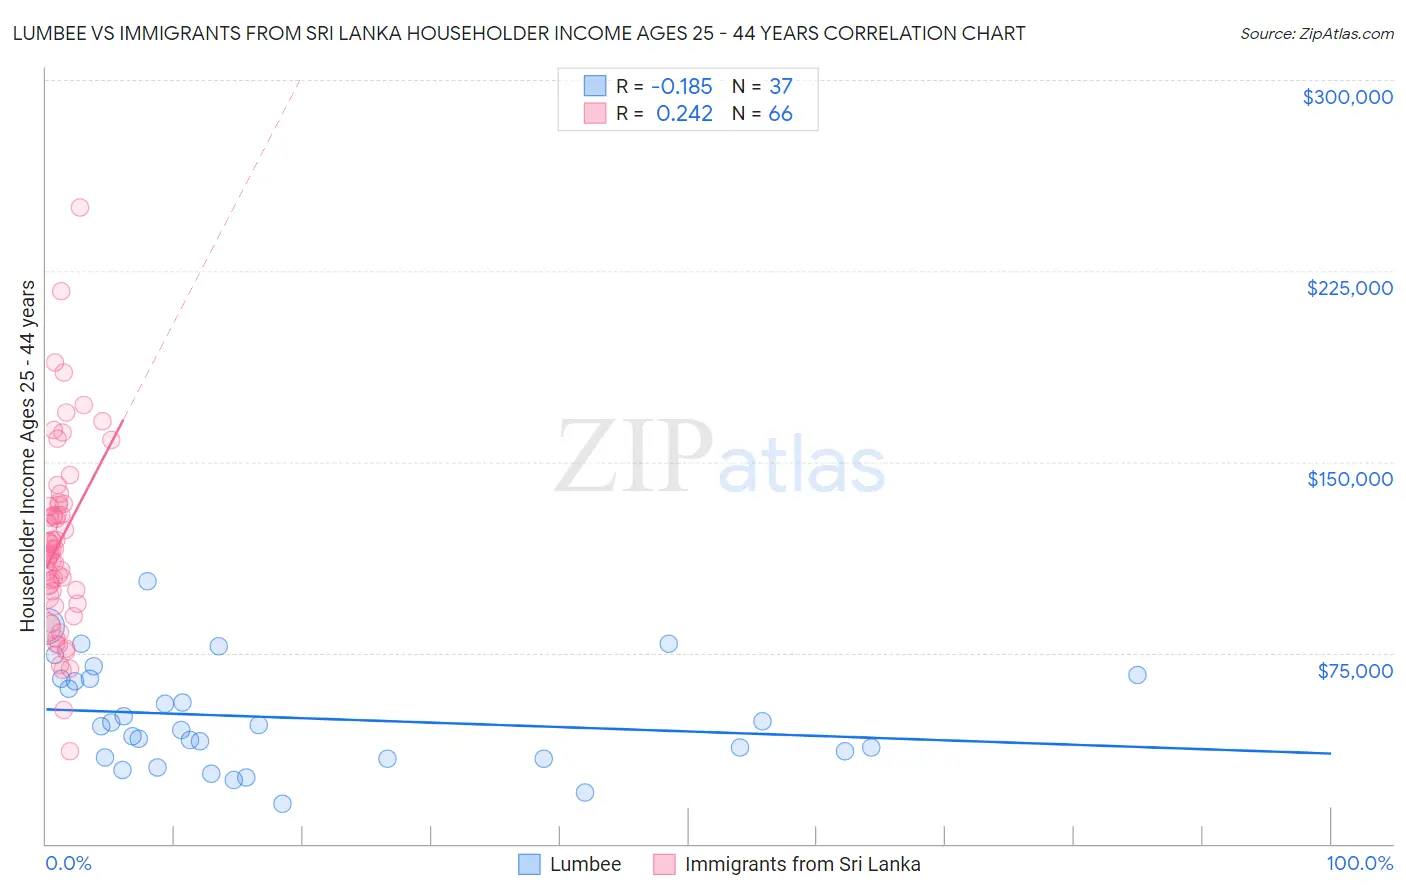
Lumbee vs Immigrants from Sri Lanka Householder Income Ages 25 - 44 years Correlation Chart
The statistical analysis conducted on geographies consisting of 92,171,944 people shows a poor negative correlation between the proportion of Lumbee and household income with householder between the ages 25 and 44 in the United States with a correlation coefficient (R) of -0.185 and weighted average of $60,305. Similarly, the statistical analysis conducted on geographies consisting of 149,615,906 people shows a weak positive correlation between the proportion of Immigrants from Sri Lanka and household income with householder between the ages 25 and 44 in the United States with a correlation coefficient (R) of 0.242 and weighted average of $109,741, a difference of 82.0%.
Householder Income Ages 25 - 44 years Correlation Summary
| Measurement | Lumbee | Immigrants from Sri Lanka |
| Minimum | $15,613 | $36,230 |
| Maximum | $103,229 | $250,001 |
| Range | $87,616 | $213,771 |
| Mean | $49,513 | $118,421 |
| Median | $46,151 | $114,758 |
| Interquartile 25% (IQ1) | $33,594 | $97,290 |
| Interquartile 75% (IQ3) | $64,818 | $133,038 |
| Interquartile Range (IQR) | $31,224 | $35,748 |
| Standard Deviation (Sample) | $20,339 | $37,121 |
| Standard Deviation (Population) | $20,063 | $36,839 |
Similar Demographics by Householder Income Ages 25 - 44 years
Demographics Similar to Lumbee by Householder Income Ages 25 - 44 years
In terms of householder income ages 25 - 44 years, the demographic groups most similar to Lumbee are Puerto Rican ($65,996, a difference of 9.4%), Navajo ($66,529, a difference of 10.3%), Pueblo ($68,910, a difference of 14.3%), Tohono O'odham ($69,068, a difference of 14.5%), and Crow ($71,337, a difference of 18.3%).
| Demographics | Rating | Rank | Householder Income Ages 25 - 44 years |
| Hopi | 0.0 /100 | #333 | Tragic $75,002 |
| Creek | 0.0 /100 | #334 | Tragic $74,847 |
| Kiowa | 0.0 /100 | #335 | Tragic $74,776 |
| Yup'ik | 0.0 /100 | #336 | Tragic $73,688 |
| Blacks/African Americans | 0.0 /100 | #337 | Tragic $73,370 |
| Immigrants | Yemen | 0.0 /100 | #338 | Tragic $73,043 |
| Yuman | 0.0 /100 | #339 | Tragic $72,956 |
| Immigrants | Congo | 0.0 /100 | #340 | Tragic $72,178 |
| Arapaho | 0.0 /100 | #341 | Tragic $71,697 |
| Crow | 0.0 /100 | #342 | Tragic $71,337 |
| Tohono O'odham | 0.0 /100 | #343 | Tragic $69,068 |
| Pueblo | 0.0 /100 | #344 | Tragic $68,910 |
| Navajo | 0.0 /100 | #345 | Tragic $66,529 |
| Puerto Ricans | 0.0 /100 | #346 | Tragic $65,996 |
| Lumbee | 0.0 /100 | #347 | Tragic $60,305 |
Demographics Similar to Immigrants from Sri Lanka by Householder Income Ages 25 - 44 years
In terms of householder income ages 25 - 44 years, the demographic groups most similar to Immigrants from Sri Lanka are Bhutanese ($109,520, a difference of 0.20%), Maltese ($110,064, a difference of 0.29%), Immigrants from Greece ($110,103, a difference of 0.33%), Bolivian ($109,372, a difference of 0.34%), and Immigrants from Switzerland ($109,185, a difference of 0.51%).
| Demographics | Rating | Rank | Householder Income Ages 25 - 44 years |
| Immigrants | Northern Europe | 100.0 /100 | #25 | Exceptional $111,676 |
| Immigrants | Asia | 100.0 /100 | #26 | Exceptional $110,787 |
| Russians | 100.0 /100 | #27 | Exceptional $110,398 |
| Immigrants | Denmark | 100.0 /100 | #28 | Exceptional $110,363 |
| Turks | 100.0 /100 | #29 | Exceptional $110,318 |
| Immigrants | Greece | 100.0 /100 | #30 | Exceptional $110,103 |
| Maltese | 100.0 /100 | #31 | Exceptional $110,064 |
| Immigrants | Sri Lanka | 100.0 /100 | #32 | Exceptional $109,741 |
| Bhutanese | 100.0 /100 | #33 | Exceptional $109,520 |
| Bolivians | 100.0 /100 | #34 | Exceptional $109,372 |
| Immigrants | Switzerland | 100.0 /100 | #35 | Exceptional $109,185 |
| Latvians | 100.0 /100 | #36 | Exceptional $108,926 |
| Immigrants | Russia | 100.0 /100 | #37 | Exceptional $108,751 |
| Soviet Union | 100.0 /100 | #38 | Exceptional $108,457 |
| Immigrants | France | 99.9 /100 | #39 | Exceptional $108,257 |