Lumbee vs Immigrants from Middle Africa Householder Income Under 25 years

COMPARE

Lumbee
Race
Ancestry
AfghanAfricanAlaska NativeAlaskan AthabascanAlbanianAleutAlsatianAmericanApacheArabArapahoArgentineanArmenianAssyrian/Chaldean/SyriacAustralianAustrianBahamianBangladeshiBarbadianBasqueBelgianBelizeanBermudanBhutaneseBlackfeetBolivianBrazilianBritishBritish West IndianBulgarianBurmeseCajunCambodianCanadianCape VerdeanCarpatho RusynCelticCentral AmericanCentral American IndianCherokeeCheyenneChickasawChileanChineseChippewaChoctawColombianColvilleComancheCosta RicanCreeCreekCroatianCrowCubanCypriotCzechCzechoslovakianDanishDelawareDominicanDutchDutch West IndianEastern EuropeanEcuadorianEgyptianEnglishEstonianEthiopianEuropeanFijianFilipinoFinnishFrenchFrench American IndianFrench CanadianGermanGerman RussianGhanaianGreekGuamanian/ChamorroGuatemalanGuyaneseHaitianHmongHonduranHopiHoumaHungarianIcelanderIndian (Asian)IndonesianInupiatIranianIraqiIrishIroquoisIsraeliItalianJamaicanJapaneseJordanianKenyanKiowaKoreanLaotianLatvianLebaneseLiberianLithuanianLumbeeLuxembourgerMacedonianMalaysianMalteseMarshalleseMenomineeMexicanMexican American IndianMongolianMoroccanNative HawaiianNavajoNepaleseNew ZealanderNicaraguanNigerianNorthern EuropeanNorwegianOkinawanOsageOttawaPaiutePakistaniPalestinianPanamanianParaguayanPennsylvania GermanPeruvianPimaPolishPortuguesePotawatomiPuebloPuerto RicanPuget Sound SalishRomanianRussianSalvadoranSamoanScandinavianScotch-IrishScottishSeminoleSenegaleseSerbianShoshoneSierra LeoneanSiouxSlavicSlovakSloveneSomaliSouth AfricanSouth AmericanSouth American IndianSoviet UnionSpaniardSpanishSpanish AmericanSpanish American IndianSri LankanSubsaharan AfricanSudaneseSwedishSwissSyrianTaiwaneseThaiTlingit-HaidaTohono O'OdhamTonganTrinidadian and TobagonianTsimshianTurkishU.S. Virgin IslanderUgandanUkrainianUruguayanUteVenezuelanVietnameseWelshWest IndianYakamaYaquiYugoslavianYumanYup'ikZimbabwean
Immigration
NonimmigrantsImmigrantsAfghanistanAfricaAlbaniaArgentinaArmeniaAsiaAustraliaAustriaBahamasBangladeshBarbadosBelarusBelgiumBelizeBoliviaBosnia and HerzegovinaBrazilBulgariaBurma/MyanmarCabo VerdeCambodiaCameroonCanadaCaribbeanCentral AmericaChileChinaColombiaCongoCosta RicaCroatiaCubaCzechoslovakiaDenmarkDominicaDominican RepublicEastern AfricaEastern AsiaEastern EuropeEcuadorEgyptEl SalvadorEnglandEritreaEthiopiaEuropeFijiFranceGermanyGhanaGreeceGrenadaGuatemalaGuyanaHaitiHondurasHong KongHungaryIndiaIndonesiaIranIraqIrelandIsraelItalyJamaicaJapanJordanKazakhstanKenyaKoreaKuwaitLaosLatin AmericaLatviaLebanonLiberiaLithuaniaMalaysiaMexicoMicronesiaMoldovaMoroccoNepalNetherlandsNicaraguaNigeriaNorth AmericaNorth MacedoniaNorthern AfricaNorthern EuropeNorwayOceaniaPakistanPanamaPeruPhilippinesPolandPortugalRomaniaRussiaSaudi ArabiaScotlandSenegalSerbiaSierra LeoneSingaporeSomaliaSouth AfricaSouth AmericaSouth Central AsiaSouth Eastern AsiaSouthern EuropeSpainSri LankaSt. Vincent and the GrenadinesSudanSwedenSwitzerlandSyriaTaiwanThailandTrinidad and TobagoTurkeyUgandaUkraineUruguayUzbekistanVenezuelaVietnamWest IndiesWestern AfricaWestern AsiaWestern EuropeYemenZaireZimbabweAzores
Immigrants from Middle Africa
Race
Ancestry
AfghanAfricanAlaska NativeAlaskan AthabascanAlbanianAleutAlsatianAmericanApacheArabArapahoArgentineanArmenianAssyrian/Chaldean/SyriacAustralianAustrianBahamianBangladeshiBarbadianBasqueBelgianBelizeanBermudanBhutaneseBlackfeetBolivianBrazilianBritishBritish West IndianBulgarianBurmeseCajunCambodianCanadianCape VerdeanCarpatho RusynCelticCentral AmericanCentral American IndianCherokeeCheyenneChickasawChileanChineseChippewaChoctawColombianColvilleComancheCosta RicanCreeCreekCroatianCrowCubanCypriotCzechCzechoslovakianDanishDelawareDominicanDutchDutch West IndianEastern EuropeanEcuadorianEgyptianEnglishEstonianEthiopianEuropeanFijianFilipinoFinnishFrenchFrench American IndianFrench CanadianGermanGerman RussianGhanaianGreekGuamanian/ChamorroGuatemalanGuyaneseHaitianHmongHonduranHopiHoumaHungarianIcelanderIndian (Asian)IndonesianInupiatIranianIraqiIrishIroquoisIsraeliItalianJamaicanJapaneseJordanianKenyanKiowaKoreanLaotianLatvianLebaneseLiberianLithuanianLuxembourgerMacedonianMalaysianMalteseMarshalleseMenomineeMexicanMexican American IndianMongolianMoroccanNative HawaiianNavajoNepaleseNew ZealanderNicaraguanNigerianNorthern EuropeanNorwegianOkinawanOsageOttawaPaiutePakistaniPalestinianPanamanianParaguayanPennsylvania GermanPeruvianPimaPolishPortuguesePotawatomiPuebloPuerto RicanPuget Sound SalishRomanianRussianSalvadoranSamoanScandinavianScotch-IrishScottishSeminoleSenegaleseSerbianShoshoneSierra LeoneanSiouxSlavicSlovakSloveneSomaliSouth AfricanSouth AmericanSouth American IndianSoviet UnionSpaniardSpanishSpanish AmericanSpanish American IndianSri LankanSubsaharan AfricanSudaneseSwedishSwissSyrianTaiwaneseThaiTlingit-HaidaTohono O'OdhamTonganTrinidadian and TobagonianTsimshianTurkishU.S. Virgin IslanderUgandanUkrainianUruguayanUteVenezuelanVietnameseWelshWest IndianYakamaYaquiYugoslavianYumanYup'ikZimbabwean
Immigration
NonimmigrantsImmigrantsAfghanistanAfricaAlbaniaArgentinaArmeniaAsiaAustraliaAustriaBahamasBangladeshBarbadosBelarusBelgiumBelizeBoliviaBosnia and HerzegovinaBrazilBulgariaBurma/MyanmarCabo VerdeCambodiaCameroonCanadaCaribbeanCentral AmericaChileChinaColombiaCongoCosta RicaCroatiaCubaCzechoslovakiaDenmarkDominicaDominican RepublicEastern AfricaEastern AsiaEastern EuropeEcuadorEgyptEl SalvadorEnglandEritreaEthiopiaEuropeFijiFranceGermanyGhanaGreeceGrenadaGuatemalaGuyanaHaitiHondurasHong KongHungaryIndiaIndonesiaIranIraqIrelandIsraelItalyJamaicaJapanJordanKazakhstanKenyaKoreaKuwaitLaosLatin AmericaLatviaLebanonLiberiaLithuaniaMalaysiaMexicoMicronesiaMiddle AfricaMoldovaMoroccoNepalNetherlandsNicaraguaNigeriaNorth AmericaNorth MacedoniaNorthern AfricaNorthern EuropeNorwayOceaniaPakistanPanamaPeruPhilippinesPolandPortugalRomaniaRussiaSaudi ArabiaScotlandSenegalSerbiaSierra LeoneSingaporeSomaliaSouth AfricaSouth AmericaSouth Central AsiaSouth Eastern AsiaSouthern EuropeSpainSri LankaSt. Vincent and the GrenadinesSudanSwedenSwitzerlandSyriaTaiwanThailandTrinidad and TobagoTurkeyUgandaUkraineUruguayUzbekistanVenezuelaVietnamWest IndiesWestern AfricaWestern AsiaWestern EuropeYemenZaireZimbabweAzores
Householder Income Under 25 years
Income
Poverty
Unemployment
Labor Participation
Family Structure
Vehicle Availability
Education Level
Disability

Householder Income Under 25 years Comparison

Lumbee

Immigrants from Middle Africa

Tragic
Tragic
$34,584
HOUSEHOLDER INCOME UNDER 25 YEARS
0.0/ 100
METRIC RATING
347th/ 347
METRIC RANK
$47,916
HOUSEHOLDER INCOME UNDER 25 YEARS
0.0/ 100
METRIC RATING
303rd/ 347
METRIC RANK

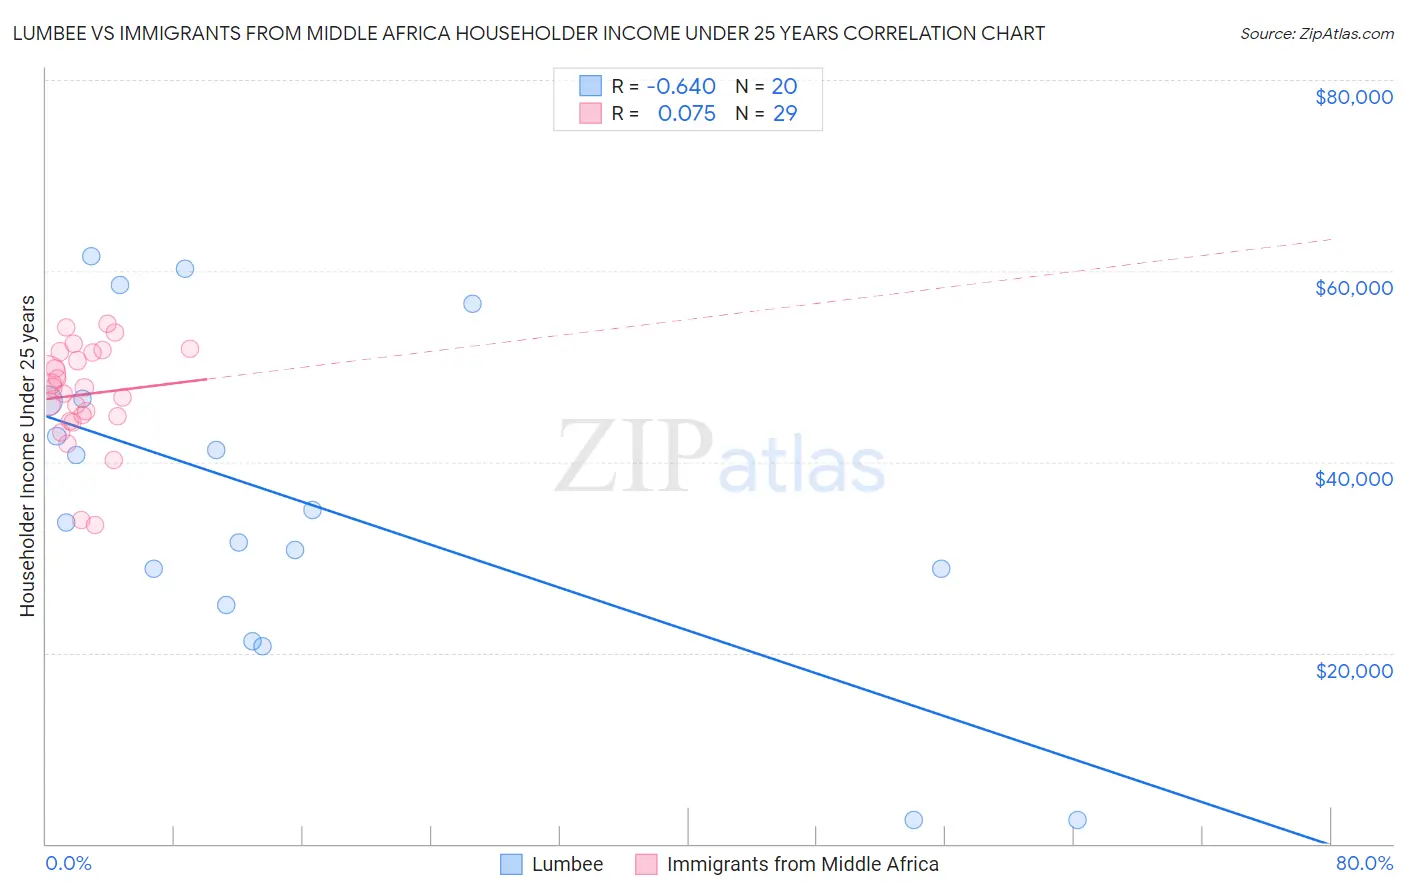
Lumbee vs Immigrants from Middle Africa Householder Income Under 25 years Correlation Chart

The statistical analysis conducted on geographies consisting of 86,473,772 people shows a significant negative correlation between the proportion of Lumbee and household income with householder under the age of 25 in the United States with a correlation coefficient (R) of -0.640 and weighted average of $34,584. Similarly, the statistical analysis conducted on geographies consisting of 185,124,339 people shows a slight positive correlation between the proportion of Immigrants from Middle Africa and household income with householder under the age of 25 in the United States with a correlation coefficient (R) of 0.075 and weighted average of $47,916, a difference of 38.6%.
Lumbee vs Immigrants from Middle Africa Householder Income Under 25 years

Householder Income Under 25 years Correlation Summary

MeasurementLumbeeImmigrants from Middle Africa
Minimum$2,499$33,425
Maximum$61,485$54,425
Range$58,986$21,000
Mean$35,754$47,045
Median$34,331$47,736
Interquartile 25% (IQ1)$26,875$44,499
Interquartile 75% (IQ3)$46,497$51,465
Interquartile Range (IQR)$19,622$6,966
Standard Deviation (Sample)$16,953$5,237
Standard Deviation (Population)$16,524$5,146

Similar Demographics by Householder Income Under 25 years

Demographics Similar to Lumbee by Householder Income Under 25 years

In terms of householder income under 25 years, the demographic groups most similar to Lumbee are Puerto Rican ($39,726, a difference of 14.9%), Navajo ($42,380, a difference of 22.5%), Immigrants from Congo ($43,266, a difference of 25.1%), Immigrants from Yemen ($43,591, a difference of 26.0%), and Arapaho ($44,003, a difference of 27.2%).
DemographicsRating | RankHouseholder Income Under 25 years
Creek
0.0
/100
|
#333
Tragic
$45,371
Cajuns
0.0
/100
|
#334
Tragic
$45,338
Cheyenne
0.0
/100
|
#335
Tragic
$45,275
Tohono O'odham
0.0
/100
|
#336
Tragic
$45,248
Pueblo
0.0
/100
|
#337
Tragic
$45,018
Chickasaw
0.0
/100
|
#338
Tragic
$44,763
Kiowa
0.0
/100
|
#339
Tragic
$44,733
Blacks/African Americans
0.0
/100
|
#340
Tragic
$44,381
Houma
0.0
/100
|
#341
Tragic
$44,356
Arapaho
0.0
/100
|
#342
Tragic
$44,003
Immigrants | Yemen
0.0
/100
|
#343
Tragic
$43,591
Immigrants | Congo
0.0
/100
|
#344
Tragic
$43,266
Navajo
0.0
/100
|
#345
Tragic
$42,380
Puerto Ricans
0.0
/100
|
#346
Tragic
$39,726
Lumbee
0.0
/100
|
#347
Tragic
$34,584

Demographics Similar to Immigrants from Middle Africa by Householder Income Under 25 years

In terms of householder income under 25 years, the demographic groups most similar to Immigrants from Middle Africa are Menominee ($47,907, a difference of 0.020%), Immigrants from Liberia ($47,981, a difference of 0.14%), Cherokee ($47,848, a difference of 0.14%), Immigrants from Kuwait ($48,126, a difference of 0.44%), and Native/Alaskan ($47,704, a difference of 0.44%).
DemographicsRating | RankHouseholder Income Under 25 years
Blackfeet
0.0
/100
|
#296
Tragic
$48,603
Cree
0.0
/100
|
#297
Tragic
$48,514
Yaqui
0.0
/100
|
#298
Tragic
$48,300
Immigrants | Honduras
0.0
/100
|
#299
Tragic
$48,267
Immigrants | Somalia
0.0
/100
|
#300
Tragic
$48,135
Immigrants | Kuwait
0.0
/100
|
#301
Tragic
$48,126
Immigrants | Liberia
0.0
/100
|
#302
Tragic
$47,981
Immigrants | Middle Africa
0.0
/100
|
#303
Tragic
$47,916
Menominee
0.0
/100
|
#304
Tragic
$47,907
Cherokee
0.0
/100
|
#305
Tragic
$47,848
Natives/Alaskans
0.0
/100
|
#306
Tragic
$47,704
Bangladeshis
0.0
/100
|
#307
Tragic
$47,589
Comanche
0.0
/100
|
#308
Tragic
$47,518
U.S. Virgin Islanders
0.0
/100
|
#309
Tragic
$47,448
Iroquois
0.0
/100
|
#310
Tragic
$47,380