Lithuanian vs Panamanian Householder Income Under 25 years

COMPARE

Lithuanian
Race
Ancestry
AfghanAfricanAlaska NativeAlaskan AthabascanAlbanianAleutAlsatianAmericanApacheArabArapahoArgentineanArmenianAssyrian/Chaldean/SyriacAustralianAustrianBahamianBangladeshiBarbadianBasqueBelgianBelizeanBermudanBhutaneseBlackfeetBolivianBrazilianBritishBritish West IndianBulgarianBurmeseCajunCambodianCanadianCape VerdeanCarpatho RusynCelticCentral AmericanCentral American IndianCherokeeCheyenneChickasawChileanChineseChippewaChoctawColombianColvilleComancheCosta RicanCreeCreekCroatianCrowCubanCypriotCzechCzechoslovakianDanishDelawareDominicanDutchDutch West IndianEastern EuropeanEcuadorianEgyptianEnglishEstonianEthiopianEuropeanFijianFilipinoFinnishFrenchFrench American IndianFrench CanadianGermanGerman RussianGhanaianGreekGuamanian/ChamorroGuatemalanGuyaneseHaitianHmongHonduranHopiHoumaHungarianIcelanderIndian (Asian)IndonesianInupiatIranianIraqiIrishIroquoisIsraeliItalianJamaicanJapaneseJordanianKenyanKiowaKoreanLaotianLatvianLebaneseLiberianLithuanianLumbeeLuxembourgerMacedonianMalaysianMalteseMarshalleseMenomineeMexicanMexican American IndianMongolianMoroccanNative HawaiianNavajoNepaleseNew ZealanderNicaraguanNigerianNorthern EuropeanNorwegianOkinawanOsageOttawaPaiutePakistaniPalestinianParaguayanPennsylvania GermanPeruvianPimaPolishPortuguesePotawatomiPuebloPuerto RicanPuget Sound SalishRomanianRussianSalvadoranSamoanScandinavianScotch-IrishScottishSeminoleSenegaleseSerbianShoshoneSierra LeoneanSiouxSlavicSlovakSloveneSomaliSouth AfricanSouth AmericanSouth American IndianSoviet UnionSpaniardSpanishSpanish AmericanSpanish American IndianSri LankanSubsaharan AfricanSudaneseSwedishSwissSyrianTaiwaneseThaiTlingit-HaidaTohono O'OdhamTonganTrinidadian and TobagonianTsimshianTurkishU.S. Virgin IslanderUgandanUkrainianUruguayanUteVenezuelanVietnameseWelshWest IndianYakamaYaquiYugoslavianYumanYup'ikZimbabwean
Immigration
NonimmigrantsImmigrantsAfghanistanAfricaAlbaniaArgentinaArmeniaAsiaAustraliaAustriaBahamasBangladeshBarbadosBelarusBelgiumBelizeBoliviaBosnia and HerzegovinaBrazilBulgariaBurma/MyanmarCabo VerdeCambodiaCameroonCanadaCaribbeanCentral AmericaChileChinaColombiaCongoCosta RicaCroatiaCubaCzechoslovakiaDenmarkDominicaDominican RepublicEastern AfricaEastern AsiaEastern EuropeEcuadorEgyptEl SalvadorEnglandEritreaEthiopiaEuropeFijiFranceGermanyGhanaGreeceGrenadaGuatemalaGuyanaHaitiHondurasHong KongHungaryIndiaIndonesiaIranIraqIrelandIsraelItalyJamaicaJapanJordanKazakhstanKenyaKoreaKuwaitLaosLatin AmericaLatviaLebanonLiberiaLithuaniaMalaysiaMexicoMicronesiaMiddle AfricaMoldovaMoroccoNepalNetherlandsNicaraguaNigeriaNorth AmericaNorth MacedoniaNorthern AfricaNorthern EuropeNorwayOceaniaPakistanPanamaPeruPhilippinesPolandPortugalRomaniaRussiaSaudi ArabiaScotlandSenegalSerbiaSierra LeoneSingaporeSomaliaSouth AfricaSouth AmericaSouth Central AsiaSouth Eastern AsiaSouthern EuropeSpainSri LankaSt. Vincent and the GrenadinesSudanSwedenSwitzerlandSyriaTaiwanThailandTrinidad and TobagoTurkeyUgandaUkraineUruguayUzbekistanVenezuelaVietnamWest IndiesWestern AfricaWestern AsiaWestern EuropeYemenZaireZimbabweAzores
Panamanian
Race
Ancestry
AfghanAfricanAlaska NativeAlaskan AthabascanAlbanianAleutAlsatianAmericanApacheArabArapahoArgentineanArmenianAssyrian/Chaldean/SyriacAustralianAustrianBahamianBangladeshiBarbadianBasqueBelgianBelizeanBermudanBhutaneseBlackfeetBolivianBrazilianBritishBritish West IndianBulgarianBurmeseCajunCambodianCanadianCape VerdeanCarpatho RusynCelticCentral AmericanCentral American IndianCherokeeCheyenneChickasawChileanChineseChippewaChoctawColombianColvilleComancheCosta RicanCreeCreekCroatianCrowCubanCypriotCzechCzechoslovakianDanishDelawareDominicanDutchDutch West IndianEastern EuropeanEcuadorianEgyptianEnglishEstonianEthiopianEuropeanFijianFilipinoFinnishFrenchFrench American IndianFrench CanadianGermanGerman RussianGhanaianGreekGuamanian/ChamorroGuatemalanGuyaneseHaitianHmongHonduranHopiHoumaHungarianIcelanderIndian (Asian)IndonesianInupiatIranianIraqiIrishIroquoisIsraeliItalianJamaicanJapaneseJordanianKenyanKiowaKoreanLaotianLatvianLebaneseLiberianLumbeeLuxembourgerMacedonianMalaysianMalteseMarshalleseMenomineeMexicanMexican American IndianMongolianMoroccanNative HawaiianNavajoNepaleseNew ZealanderNicaraguanNigerianNorthern EuropeanNorwegianOkinawanOsageOttawaPaiutePakistaniPalestinianPanamanianParaguayanPennsylvania GermanPeruvianPimaPolishPortuguesePotawatomiPuebloPuerto RicanPuget Sound SalishRomanianRussianSalvadoranSamoanScandinavianScotch-IrishScottishSeminoleSenegaleseSerbianShoshoneSierra LeoneanSiouxSlavicSlovakSloveneSomaliSouth AfricanSouth AmericanSouth American IndianSoviet UnionSpaniardSpanishSpanish AmericanSpanish American IndianSri LankanSubsaharan AfricanSudaneseSwedishSwissSyrianTaiwaneseThaiTlingit-HaidaTohono O'OdhamTonganTrinidadian and TobagonianTsimshianTurkishU.S. Virgin IslanderUgandanUkrainianUruguayanUteVenezuelanVietnameseWelshWest IndianYakamaYaquiYugoslavianYumanYup'ikZimbabwean
Immigration
NonimmigrantsImmigrantsAfghanistanAfricaAlbaniaArgentinaArmeniaAsiaAustraliaAustriaBahamasBangladeshBarbadosBelarusBelgiumBelizeBoliviaBosnia and HerzegovinaBrazilBulgariaBurma/MyanmarCabo VerdeCambodiaCameroonCanadaCaribbeanCentral AmericaChileChinaColombiaCongoCosta RicaCroatiaCubaCzechoslovakiaDenmarkDominicaDominican RepublicEastern AfricaEastern AsiaEastern EuropeEcuadorEgyptEl SalvadorEnglandEritreaEthiopiaEuropeFijiFranceGermanyGhanaGreeceGrenadaGuatemalaGuyanaHaitiHondurasHong KongHungaryIndiaIndonesiaIranIraqIrelandIsraelItalyJamaicaJapanJordanKazakhstanKenyaKoreaKuwaitLaosLatin AmericaLatviaLebanonLiberiaLithuaniaMalaysiaMexicoMicronesiaMiddle AfricaMoldovaMoroccoNepalNetherlandsNicaraguaNigeriaNorth AmericaNorth MacedoniaNorthern AfricaNorthern EuropeNorwayOceaniaPakistanPanamaPeruPhilippinesPolandPortugalRomaniaRussiaSaudi ArabiaScotlandSenegalSerbiaSierra LeoneSingaporeSomaliaSouth AfricaSouth AmericaSouth Central AsiaSouth Eastern AsiaSouthern EuropeSpainSri LankaSt. Vincent and the GrenadinesSudanSwedenSwitzerlandSyriaTaiwanThailandTrinidad and TobagoTurkeyUgandaUkraineUruguayUzbekistanVenezuelaVietnamWest IndiesWestern AfricaWestern AsiaWestern EuropeYemenZaireZimbabweAzores
Householder Income Under 25 years
Income
Poverty
Unemployment
Labor Participation
Family Structure
Vehicle Availability
Education Level
Disability

Householder Income Under 25 years Comparison

Lithuanians

Panamanians

Exceptional
Poor
$53,552
HOUSEHOLDER INCOME UNDER 25 YEARS
96.6/ 100
METRIC RATING
117th/ 347
METRIC RANK
$51,611
HOUSEHOLDER INCOME UNDER 25 YEARS
19.5/ 100
METRIC RATING
191st/ 347
METRIC RANK

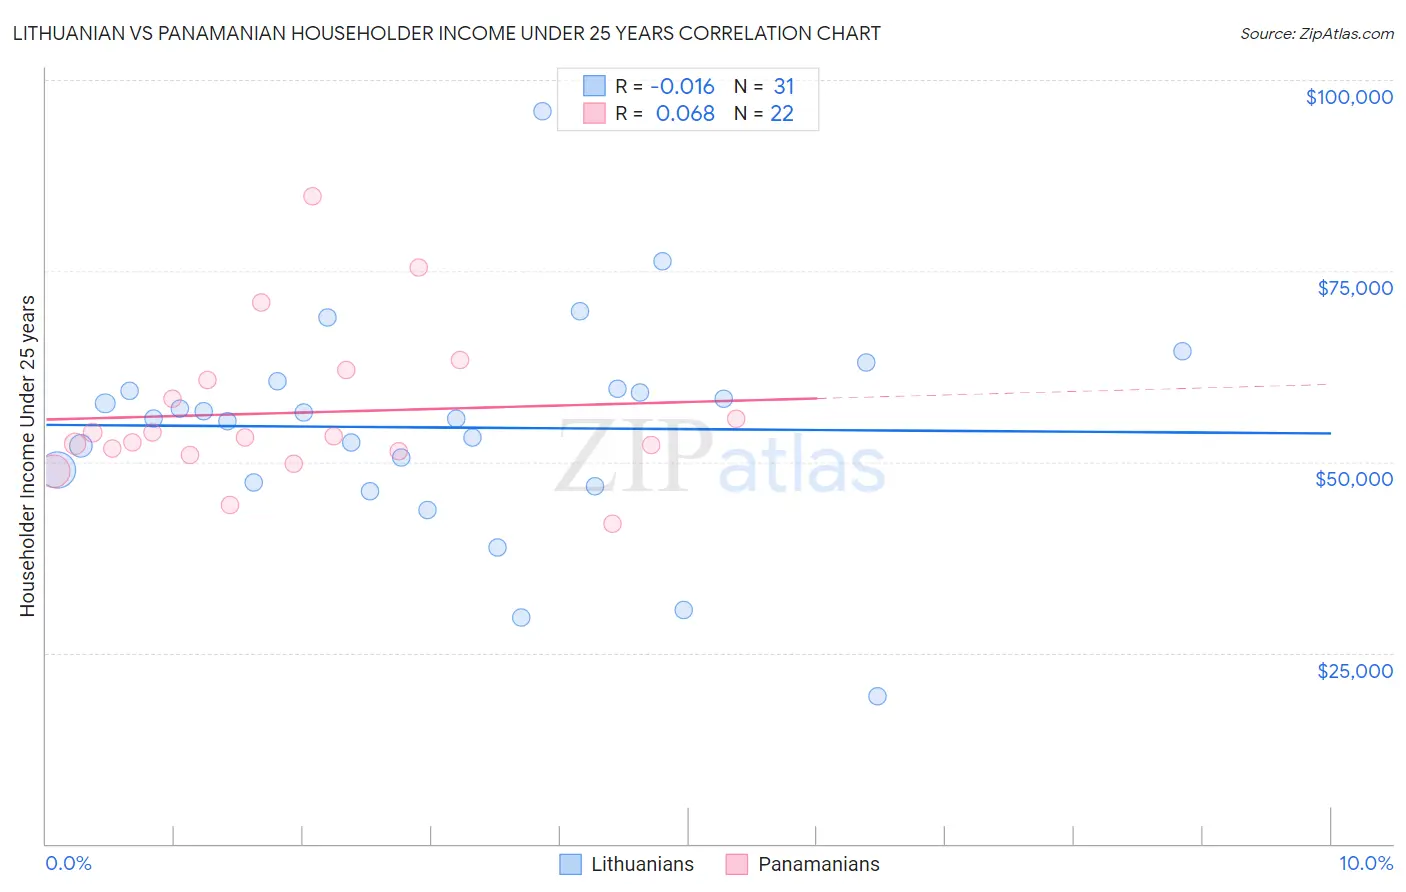
Lithuanian vs Panamanian Householder Income Under 25 years Correlation Chart

The statistical analysis conducted on geographies consisting of 345,043,836 people shows no correlation between the proportion of Lithuanians and household income with householder under the age of 25 in the United States with a correlation coefficient (R) of -0.016 and weighted average of $53,552. Similarly, the statistical analysis conducted on geographies consisting of 249,167,453 people shows a slight positive correlation between the proportion of Panamanians and household income with householder under the age of 25 in the United States with a correlation coefficient (R) of 0.068 and weighted average of $51,611, a difference of 3.8%.
Lithuanian vs Panamanian Householder Income Under 25 years

Householder Income Under 25 years Correlation Summary

MeasurementLithuanianPanamanian
Minimum$19,375$41,875
Maximum$95,845$84,853
Range$76,470$42,978
Mean$54,494$56,431
Median$55,664$53,276
Interquartile 25% (IQ1)$47,340$51,350
Interquartile 75% (IQ3)$59,595$60,790
Interquartile Range (IQR)$12,255$9,440
Standard Deviation (Sample)$14,114$10,018
Standard Deviation (Population)$13,885$9,787

Similar Demographics by Householder Income Under 25 years

Demographics Similar to Lithuanians by Householder Income Under 25 years

In terms of householder income under 25 years, the demographic groups most similar to Lithuanians are Immigrants from Spain ($53,560, a difference of 0.010%), Immigrants from Switzerland ($53,528, a difference of 0.050%), Immigrants from Albania ($53,597, a difference of 0.080%), Immigrants from Sweden ($53,621, a difference of 0.13%), and Romanian ($53,632, a difference of 0.15%).
DemographicsRating | RankHouseholder Income Under 25 years
Greeks
97.7
/100
|
#110
Exceptional
$53,715
Immigrants | Colombia
97.7
/100
|
#111
Exceptional
$53,714
Immigrants | Oceania
97.5
/100
|
#112
Exceptional
$53,680
Romanians
97.2
/100
|
#113
Exceptional
$53,632
Immigrants | Sweden
97.1
/100
|
#114
Exceptional
$53,621
Immigrants | Albania
96.9
/100
|
#115
Exceptional
$53,597
Immigrants | Spain
96.6
/100
|
#116
Exceptional
$53,560
Lithuanians
96.6
/100
|
#117
Exceptional
$53,552
Immigrants | Switzerland
96.3
/100
|
#118
Exceptional
$53,528
Italians
95.4
/100
|
#119
Exceptional
$53,426
Guamanians/Chamorros
95.3
/100
|
#120
Exceptional
$53,423
Immigrants | Canada
95.2
/100
|
#121
Exceptional
$53,411
Immigrants | Ethiopia
95.2
/100
|
#122
Exceptional
$53,408
Immigrants | Iraq
94.9
/100
|
#123
Exceptional
$53,384
Colombians
94.6
/100
|
#124
Exceptional
$53,357

Demographics Similar to Panamanians by Householder Income Under 25 years

In terms of householder income under 25 years, the demographic groups most similar to Panamanians are Malaysian ($51,615, a difference of 0.010%), West Indian ($51,583, a difference of 0.060%), Immigrants from Eritrea ($51,574, a difference of 0.070%), Croatian ($51,662, a difference of 0.10%), and Northern European ($51,678, a difference of 0.13%).
DemographicsRating | RankHouseholder Income Under 25 years
Paiute
25.1
/100
|
#184
Fair
$51,743
Immigrants | Latvia
24.8
/100
|
#185
Fair
$51,737
Alaskan Athabascans
23.8
/100
|
#186
Fair
$51,713
Immigrants | South Africa
23.4
/100
|
#187
Fair
$51,705
Northern Europeans
22.2
/100
|
#188
Fair
$51,678
Croatians
21.6
/100
|
#189
Fair
$51,662
Malaysians
19.7
/100
|
#190
Poor
$51,615
Panamanians
19.5
/100
|
#191
Poor
$51,611
West Indians
18.5
/100
|
#192
Poor
$51,583
Immigrants | Eritrea
18.1
/100
|
#193
Poor
$51,574
Guatemalans
16.4
/100
|
#194
Poor
$51,525
Estonians
16.4
/100
|
#195
Poor
$51,523
Palestinians
16.1
/100
|
#196
Poor
$51,515
Pima
15.7
/100
|
#197
Poor
$51,503
Immigrants | Syria
15.4
/100
|
#198
Poor
$51,494