Lithuanian vs Pakistani Median Male Earnings
COMPARE
Lithuanian
Pakistani
Median Male Earnings
Median Male Earnings Comparison
Lithuanians
Pakistanis
$61,228
MEDIAN MALE EARNINGS
99.9/ 100
METRIC RATING
56th/ 347
METRIC RANK
$56,719
MEDIAN MALE EARNINGS
89.9/ 100
METRIC RATING
129th/ 347
METRIC RANK
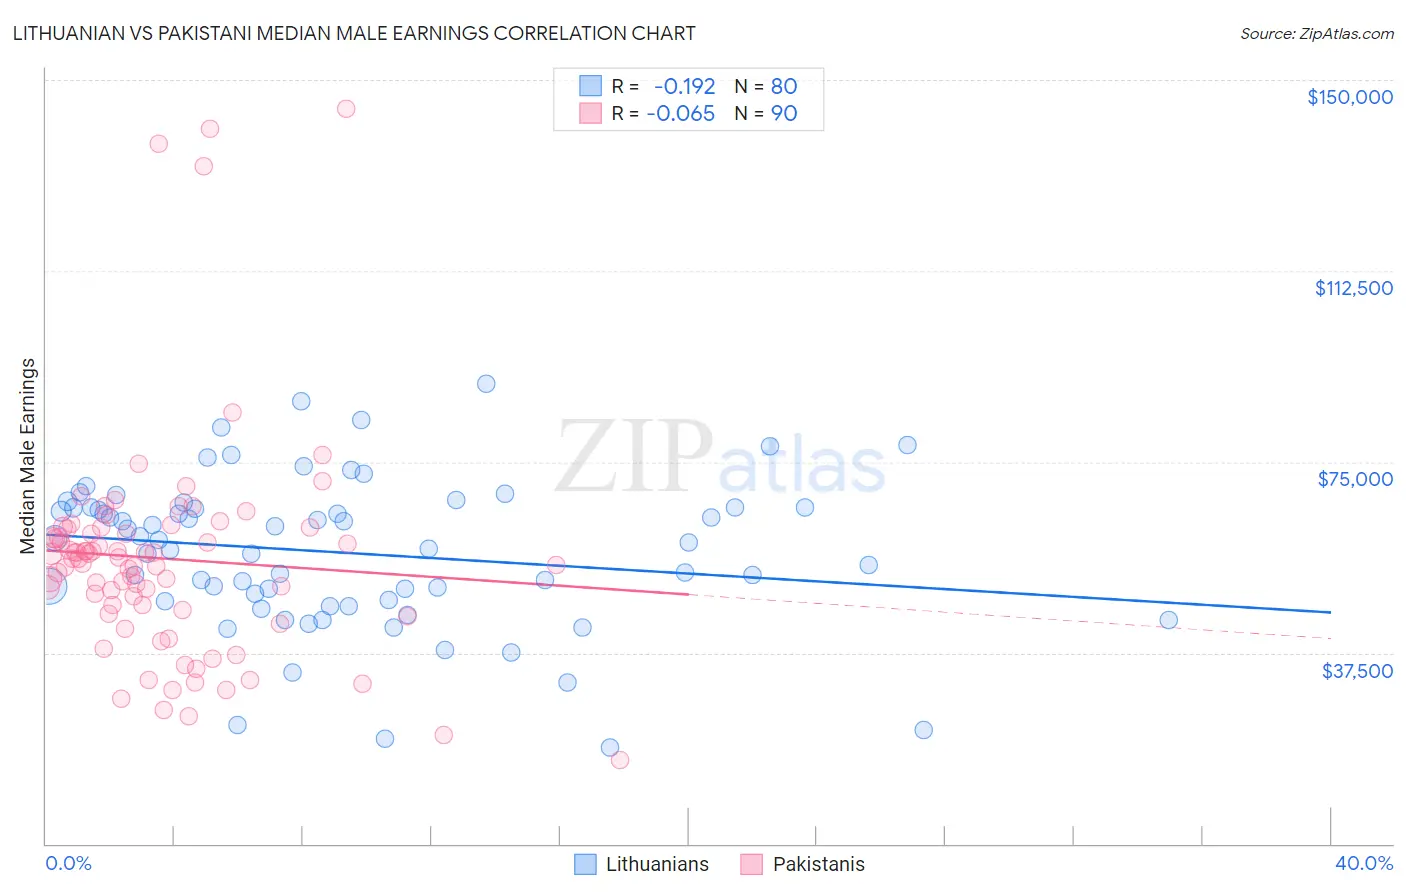
Lithuanian vs Pakistani Median Male Earnings Correlation Chart
The statistical analysis conducted on geographies consisting of 421,749,133 people shows a poor negative correlation between the proportion of Lithuanians and median male earnings in the United States with a correlation coefficient (R) of -0.192 and weighted average of $61,228. Similarly, the statistical analysis conducted on geographies consisting of 335,324,155 people shows a slight negative correlation between the proportion of Pakistanis and median male earnings in the United States with a correlation coefficient (R) of -0.065 and weighted average of $56,719, a difference of 8.0%.
Median Male Earnings Correlation Summary
| Measurement | Lithuanian | Pakistani |
| Minimum | $18,839 | $16,406 |
| Maximum | $90,313 | $144,236 |
| Range | $71,474 | $127,830 |
| Mean | $57,160 | $56,003 |
| Median | $59,359 | $55,878 |
| Interquartile 25% (IQ1) | $47,714 | $45,960 |
| Interquartile 75% (IQ3) | $66,000 | $61,933 |
| Interquartile Range (IQR) | $18,286 | $15,973 |
| Standard Deviation (Sample) | $14,769 | $22,100 |
| Standard Deviation (Population) | $14,676 | $21,977 |
Similar Demographics by Median Male Earnings
Demographics Similar to Lithuanians by Median Male Earnings
In terms of median male earnings, the demographic groups most similar to Lithuanians are Immigrants from Scotland ($61,220, a difference of 0.010%), Greek ($61,242, a difference of 0.020%), New Zealander ($61,199, a difference of 0.050%), Immigrants from Netherlands ($61,096, a difference of 0.22%), and Egyptian ($61,095, a difference of 0.22%).
| Demographics | Rating | Rank | Median Male Earnings |
| Immigrants | Europe | 99.9 /100 | #49 | Exceptional $62,057 |
| Bhutanese | 99.9 /100 | #50 | Exceptional $61,759 |
| Estonians | 99.9 /100 | #51 | Exceptional $61,710 |
| Immigrants | Norway | 99.9 /100 | #52 | Exceptional $61,628 |
| South Africans | 99.9 /100 | #53 | Exceptional $61,460 |
| Immigrants | Latvia | 99.9 /100 | #54 | Exceptional $61,422 |
| Greeks | 99.9 /100 | #55 | Exceptional $61,242 |
| Lithuanians | 99.9 /100 | #56 | Exceptional $61,228 |
| Immigrants | Scotland | 99.9 /100 | #57 | Exceptional $61,220 |
| New Zealanders | 99.9 /100 | #58 | Exceptional $61,199 |
| Immigrants | Netherlands | 99.8 /100 | #59 | Exceptional $61,096 |
| Egyptians | 99.8 /100 | #60 | Exceptional $61,095 |
| Bolivians | 99.8 /100 | #61 | Exceptional $61,066 |
| Immigrants | Romania | 99.8 /100 | #62 | Exceptional $61,040 |
| Immigrants | Pakistan | 99.8 /100 | #63 | Exceptional $60,987 |
Demographics Similar to Pakistanis by Median Male Earnings
In terms of median male earnings, the demographic groups most similar to Pakistanis are Korean ($56,672, a difference of 0.080%), Portuguese ($56,663, a difference of 0.10%), Immigrants from Syria ($56,830, a difference of 0.20%), Brazilian ($56,837, a difference of 0.21%), and Chinese ($56,872, a difference of 0.27%).
| Demographics | Rating | Rank | Median Male Earnings |
| Immigrants | Jordan | 93.1 /100 | #122 | Exceptional $57,145 |
| Slovenes | 93.1 /100 | #123 | Exceptional $57,145 |
| Chileans | 91.9 /100 | #124 | Exceptional $56,973 |
| Immigrants | Morocco | 91.8 /100 | #125 | Exceptional $56,958 |
| Chinese | 91.1 /100 | #126 | Exceptional $56,872 |
| Brazilians | 90.9 /100 | #127 | Exceptional $56,837 |
| Immigrants | Syria | 90.8 /100 | #128 | Exceptional $56,830 |
| Pakistanis | 89.9 /100 | #129 | Excellent $56,719 |
| Koreans | 89.4 /100 | #130 | Excellent $56,672 |
| Portuguese | 89.4 /100 | #131 | Excellent $56,663 |
| Czechs | 88.2 /100 | #132 | Excellent $56,546 |
| Immigrants | Germany | 88.2 /100 | #133 | Excellent $56,542 |
| Moroccans | 87.7 /100 | #134 | Excellent $56,499 |
| Irish | 87.4 /100 | #135 | Excellent $56,464 |
| Immigrants | Saudi Arabia | 87.2 /100 | #136 | Excellent $56,452 |