Lithuanian vs Immigrants from Norway Householder Income Ages 25 - 44 years

COMPARE

Lithuanian
Race
Ancestry
AfghanAfricanAlaska NativeAlaskan AthabascanAlbanianAleutAlsatianAmericanApacheArabArapahoArgentineanArmenianAssyrian/Chaldean/SyriacAustralianAustrianBahamianBangladeshiBarbadianBasqueBelgianBelizeanBermudanBhutaneseBlackfeetBolivianBrazilianBritishBritish West IndianBulgarianBurmeseCajunCambodianCanadianCape VerdeanCarpatho RusynCelticCentral AmericanCentral American IndianCherokeeCheyenneChickasawChileanChineseChippewaChoctawColombianColvilleComancheCosta RicanCreeCreekCroatianCrowCubanCypriotCzechCzechoslovakianDanishDelawareDominicanDutchDutch West IndianEastern EuropeanEcuadorianEgyptianEnglishEstonianEthiopianEuropeanFijianFilipinoFinnishFrenchFrench American IndianFrench CanadianGermanGerman RussianGhanaianGreekGuamanian/ChamorroGuatemalanGuyaneseHaitianHmongHonduranHopiHoumaHungarianIcelanderIndian (Asian)IndonesianInupiatIranianIraqiIrishIroquoisIsraeliItalianJamaicanJapaneseJordanianKenyanKiowaKoreanLaotianLatvianLebaneseLiberianLithuanianLumbeeLuxembourgerMacedonianMalaysianMalteseMarshalleseMenomineeMexicanMexican American IndianMongolianMoroccanNative HawaiianNavajoNepaleseNew ZealanderNicaraguanNigerianNorthern EuropeanNorwegianOkinawanOsageOttawaPaiutePakistaniPalestinianPanamanianParaguayanPennsylvania GermanPeruvianPimaPolishPortuguesePotawatomiPuebloPuerto RicanPuget Sound SalishRomanianRussianSalvadoranSamoanScandinavianScotch-IrishScottishSeminoleSenegaleseSerbianShoshoneSierra LeoneanSiouxSlavicSlovakSloveneSomaliSouth AfricanSouth AmericanSouth American IndianSoviet UnionSpaniardSpanishSpanish AmericanSpanish American IndianSri LankanSubsaharan AfricanSudaneseSwedishSwissSyrianTaiwaneseThaiTlingit-HaidaTohono O'OdhamTonganTrinidadian and TobagonianTsimshianTurkishU.S. Virgin IslanderUgandanUkrainianUruguayanUteVenezuelanVietnameseWelshWest IndianYakamaYaquiYugoslavianYumanYup'ikZimbabwean
Immigration
NonimmigrantsImmigrantsAfghanistanAfricaAlbaniaArgentinaArmeniaAsiaAustraliaAustriaBahamasBangladeshBarbadosBelarusBelgiumBelizeBoliviaBosnia and HerzegovinaBrazilBulgariaBurma/MyanmarCabo VerdeCambodiaCameroonCanadaCaribbeanCentral AmericaChileChinaColombiaCongoCosta RicaCroatiaCubaCzechoslovakiaDenmarkDominicaDominican RepublicEastern AfricaEastern AsiaEastern EuropeEcuadorEgyptEl SalvadorEnglandEritreaEthiopiaEuropeFijiFranceGermanyGhanaGreeceGrenadaGuatemalaGuyanaHaitiHondurasHong KongHungaryIndiaIndonesiaIranIraqIrelandIsraelItalyJamaicaJapanJordanKazakhstanKenyaKoreaKuwaitLaosLatin AmericaLatviaLebanonLiberiaLithuaniaMalaysiaMexicoMicronesiaMiddle AfricaMoldovaMoroccoNepalNetherlandsNicaraguaNigeriaNorth AmericaNorth MacedoniaNorthern AfricaNorthern EuropeOceaniaPakistanPanamaPeruPhilippinesPolandPortugalRomaniaRussiaSaudi ArabiaScotlandSenegalSerbiaSierra LeoneSingaporeSomaliaSouth AfricaSouth AmericaSouth Central AsiaSouth Eastern AsiaSouthern EuropeSpainSri LankaSt. Vincent and the GrenadinesSudanSwedenSwitzerlandSyriaTaiwanThailandTrinidad and TobagoTurkeyUgandaUkraineUruguayUzbekistanVenezuelaVietnamWest IndiesWestern AfricaWestern AsiaWestern EuropeYemenZaireZimbabweAzores
Immigrants from Norway
Race
Ancestry
AfghanAfricanAlaska NativeAlaskan AthabascanAlbanianAleutAlsatianAmericanApacheArabArapahoArgentineanArmenianAssyrian/Chaldean/SyriacAustralianAustrianBahamianBangladeshiBarbadianBasqueBelgianBelizeanBermudanBhutaneseBlackfeetBolivianBrazilianBritishBritish West IndianBulgarianBurmeseCajunCambodianCanadianCape VerdeanCarpatho RusynCelticCentral AmericanCentral American IndianCherokeeCheyenneChickasawChileanChineseChippewaChoctawColombianColvilleComancheCosta RicanCreeCreekCroatianCrowCubanCypriotCzechCzechoslovakianDanishDelawareDominicanDutchDutch West IndianEastern EuropeanEcuadorianEgyptianEnglishEstonianEthiopianEuropeanFijianFilipinoFinnishFrenchFrench American IndianFrench CanadianGermanGerman RussianGhanaianGreekGuamanian/ChamorroGuatemalanGuyaneseHaitianHmongHonduranHopiHoumaHungarianIcelanderIndian (Asian)IndonesianInupiatIranianIraqiIrishIroquoisIsraeliItalianJamaicanJapaneseJordanianKenyanKiowaKoreanLaotianLatvianLebaneseLiberianLumbeeLuxembourgerMacedonianMalaysianMalteseMarshalleseMenomineeMexicanMexican American IndianMongolianMoroccanNative HawaiianNavajoNepaleseNew ZealanderNicaraguanNigerianNorthern EuropeanNorwegianOkinawanOsageOttawaPaiutePakistaniPalestinianPanamanianParaguayanPennsylvania GermanPeruvianPimaPolishPortuguesePotawatomiPuebloPuerto RicanPuget Sound SalishRomanianRussianSalvadoranSamoanScandinavianScotch-IrishScottishSeminoleSenegaleseSerbianShoshoneSierra LeoneanSiouxSlavicSlovakSloveneSomaliSouth AfricanSouth AmericanSouth American IndianSoviet UnionSpaniardSpanishSpanish AmericanSpanish American IndianSri LankanSubsaharan AfricanSudaneseSwedishSwissSyrianTaiwaneseThaiTlingit-HaidaTohono O'OdhamTonganTrinidadian and TobagonianTsimshianTurkishU.S. Virgin IslanderUgandanUkrainianUruguayanUteVenezuelanVietnameseWelshWest IndianYakamaYaquiYugoslavianYumanYup'ikZimbabwean
Immigration
NonimmigrantsImmigrantsAfghanistanAfricaAlbaniaArgentinaArmeniaAsiaAustraliaAustriaBahamasBangladeshBarbadosBelarusBelgiumBelizeBoliviaBosnia and HerzegovinaBrazilBulgariaBurma/MyanmarCabo VerdeCambodiaCameroonCanadaCaribbeanCentral AmericaChileChinaColombiaCongoCosta RicaCroatiaCubaCzechoslovakiaDenmarkDominicaDominican RepublicEastern AfricaEastern AsiaEastern EuropeEcuadorEgyptEl SalvadorEnglandEritreaEthiopiaEuropeFijiFranceGermanyGhanaGreeceGrenadaGuatemalaGuyanaHaitiHondurasHong KongHungaryIndiaIndonesiaIranIraqIrelandIsraelItalyJamaicaJapanJordanKazakhstanKenyaKoreaKuwaitLaosLatin AmericaLatviaLebanonLiberiaLithuaniaMalaysiaMexicoMicronesiaMiddle AfricaMoldovaMoroccoNepalNetherlandsNicaraguaNigeriaNorth AmericaNorth MacedoniaNorthern AfricaNorthern EuropeNorwayOceaniaPakistanPanamaPeruPhilippinesPolandPortugalRomaniaRussiaSaudi ArabiaScotlandSenegalSerbiaSierra LeoneSingaporeSomaliaSouth AfricaSouth AmericaSouth Central AsiaSouth Eastern AsiaSouthern EuropeSpainSri LankaSt. Vincent and the GrenadinesSudanSwedenSwitzerlandSyriaTaiwanThailandTrinidad and TobagoTurkeyUgandaUkraineUruguayUzbekistanVenezuelaVietnamWest IndiesWestern AfricaWestern AsiaWestern EuropeYemenZaireZimbabweAzores
Householder Income Ages 25 - 44 years
Income
Poverty
Unemployment
Labor Participation
Family Structure
Vehicle Availability
Education Level
Disability

Householder Income Ages 25 - 44 years Comparison

Lithuanians

Immigrants from Norway

Exceptional
Exceptional
$105,223
HOUSEHOLDER INCOME AGES 25 - 44 YEARS
99.7/ 100
METRIC RATING
61st/ 347
METRIC RANK
$106,629
HOUSEHOLDER INCOME AGES 25 - 44 YEARS
99.9/ 100
METRIC RATING
53rd/ 347
METRIC RANK

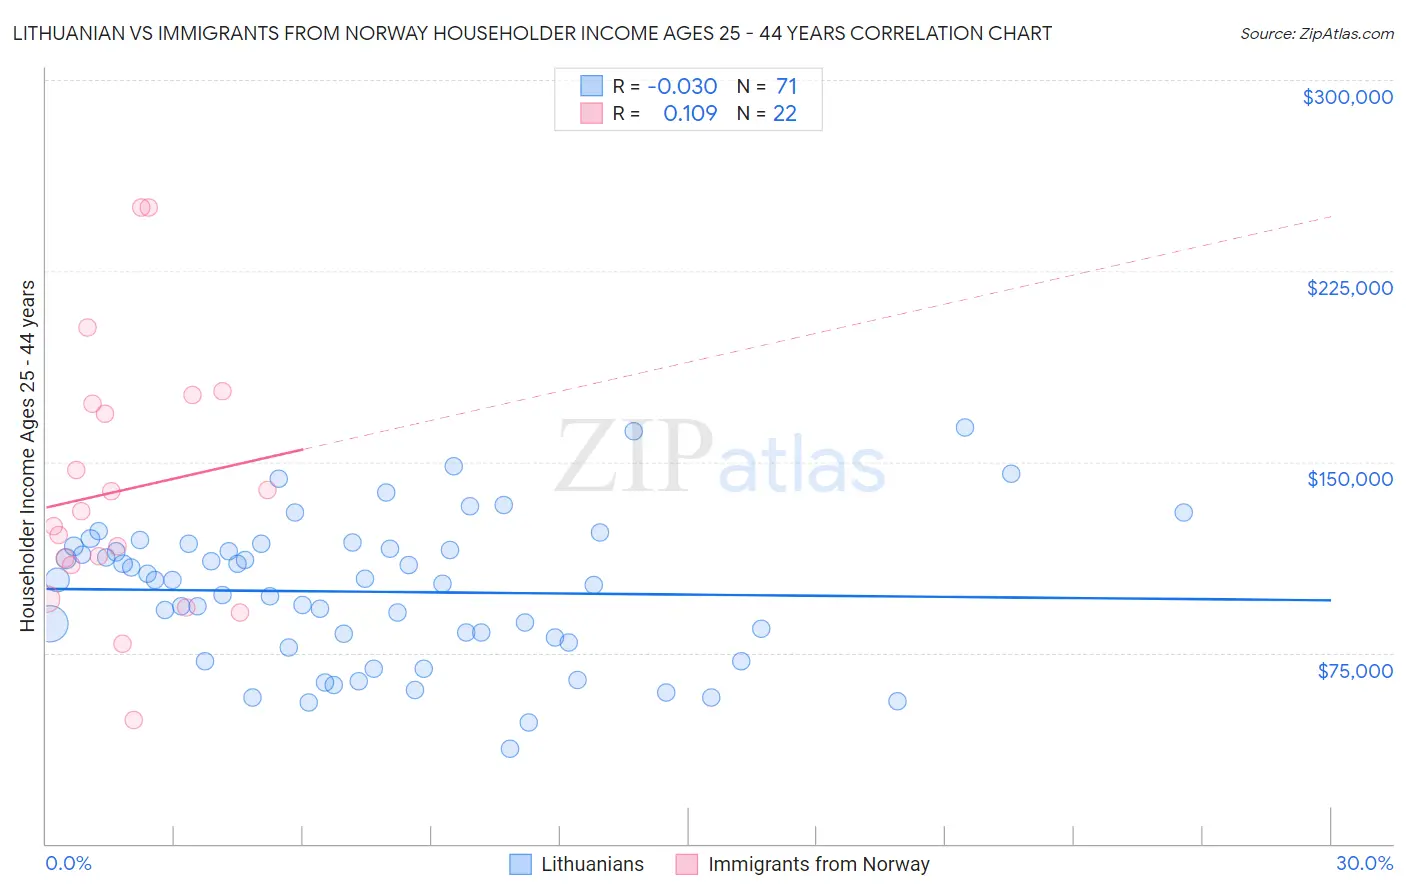
Lithuanian vs Immigrants from Norway Householder Income Ages 25 - 44 years Correlation Chart

The statistical analysis conducted on geographies consisting of 420,458,262 people shows no correlation between the proportion of Lithuanians and household income with householder between the ages 25 and 44 in the United States with a correlation coefficient (R) of -0.030 and weighted average of $105,223. Similarly, the statistical analysis conducted on geographies consisting of 116,548,648 people shows a poor positive correlation between the proportion of Immigrants from Norway and household income with householder between the ages 25 and 44 in the United States with a correlation coefficient (R) of 0.109 and weighted average of $106,629, a difference of 1.3%.
Lithuanian vs Immigrants from Norway Householder Income Ages 25 - 44 years

Householder Income Ages 25 - 44 years Correlation Summary

MeasurementLithuanianImmigrants from Norway
Minimum$37,413$48,750
Maximum$163,542$250,001
Range$126,129$201,251
Mean$98,966$138,956
Median$103,489$127,644
Interquartile 25% (IQ1)$78,970$109,255
Interquartile 75% (IQ3)$116,848$172,615
Interquartile Range (IQR)$37,878$63,360
Standard Deviation (Sample)$27,829$51,236
Standard Deviation (Population)$27,632$50,058

Demographics Similar to Lithuanians and Immigrants from Norway by Householder Income Ages 25 - 44 years

In terms of householder income ages 25 - 44 years, the demographic groups most similar to Lithuanians are Immigrants from Italy ($105,201, a difference of 0.020%), Egyptian ($105,282, a difference of 0.060%), Immigrants from Scotland ($105,089, a difference of 0.13%), New Zealander ($105,085, a difference of 0.13%), and Immigrants from Netherlands ($105,082, a difference of 0.13%). Similarly, the demographic groups most similar to Immigrants from Norway are Paraguayan ($106,615, a difference of 0.010%), Greek ($106,457, a difference of 0.16%), Immigrants from Europe ($106,817, a difference of 0.18%), Immigrants from Czechoslovakia ($106,888, a difference of 0.24%), and Immigrants from Pakistan ($106,129, a difference of 0.47%).
DemographicsRating | RankHouseholder Income Ages 25 - 44 years
Estonians
99.9
/100
|
#47
Exceptional
$107,269
Bulgarians
99.9
/100
|
#48
Exceptional
$107,264
Immigrants | Turkey
99.9
/100
|
#49
Exceptional
$107,258
Cambodians
99.9
/100
|
#50
Exceptional
$107,148
Immigrants | Czechoslovakia
99.9
/100
|
#51
Exceptional
$106,888
Immigrants | Europe
99.9
/100
|
#52
Exceptional
$106,817
Immigrants | Norway
99.9
/100
|
#53
Exceptional
$106,629
Paraguayans
99.9
/100
|
#54
Exceptional
$106,615
Greeks
99.9
/100
|
#55
Exceptional
$106,457
Immigrants | Pakistan
99.8
/100
|
#56
Exceptional
$106,129
Immigrants | Austria
99.8
/100
|
#57
Exceptional
$106,103
Immigrants | South Africa
99.8
/100
|
#58
Exceptional
$105,748
Immigrants | Latvia
99.8
/100
|
#59
Exceptional
$105,522
Egyptians
99.7
/100
|
#60
Exceptional
$105,282
Lithuanians
99.7
/100
|
#61
Exceptional
$105,223
Immigrants | Italy
99.7
/100
|
#62
Exceptional
$105,201
Immigrants | Scotland
99.7
/100
|
#63
Exceptional
$105,089
New Zealanders
99.7
/100
|
#64
Exceptional
$105,085
Immigrants | Netherlands
99.7
/100
|
#65
Exceptional
$105,082
Laotians
99.7
/100
|
#66
Exceptional
$104,993
Immigrants | Romania
99.6
/100
|
#67
Exceptional
$104,713