Lithuanian vs Filipino Householder Income Over 65 years
COMPARE
Lithuanian
Filipino
Householder Income Over 65 years
Householder Income Over 65 years Comparison
Lithuanians
Filipinos
$65,209
HOUSEHOLDER INCOME OVER 65 YEARS
98.8/ 100
METRIC RATING
74th/ 347
METRIC RANK
$76,686
HOUSEHOLDER INCOME OVER 65 YEARS
100.0/ 100
METRIC RATING
4th/ 347
METRIC RANK
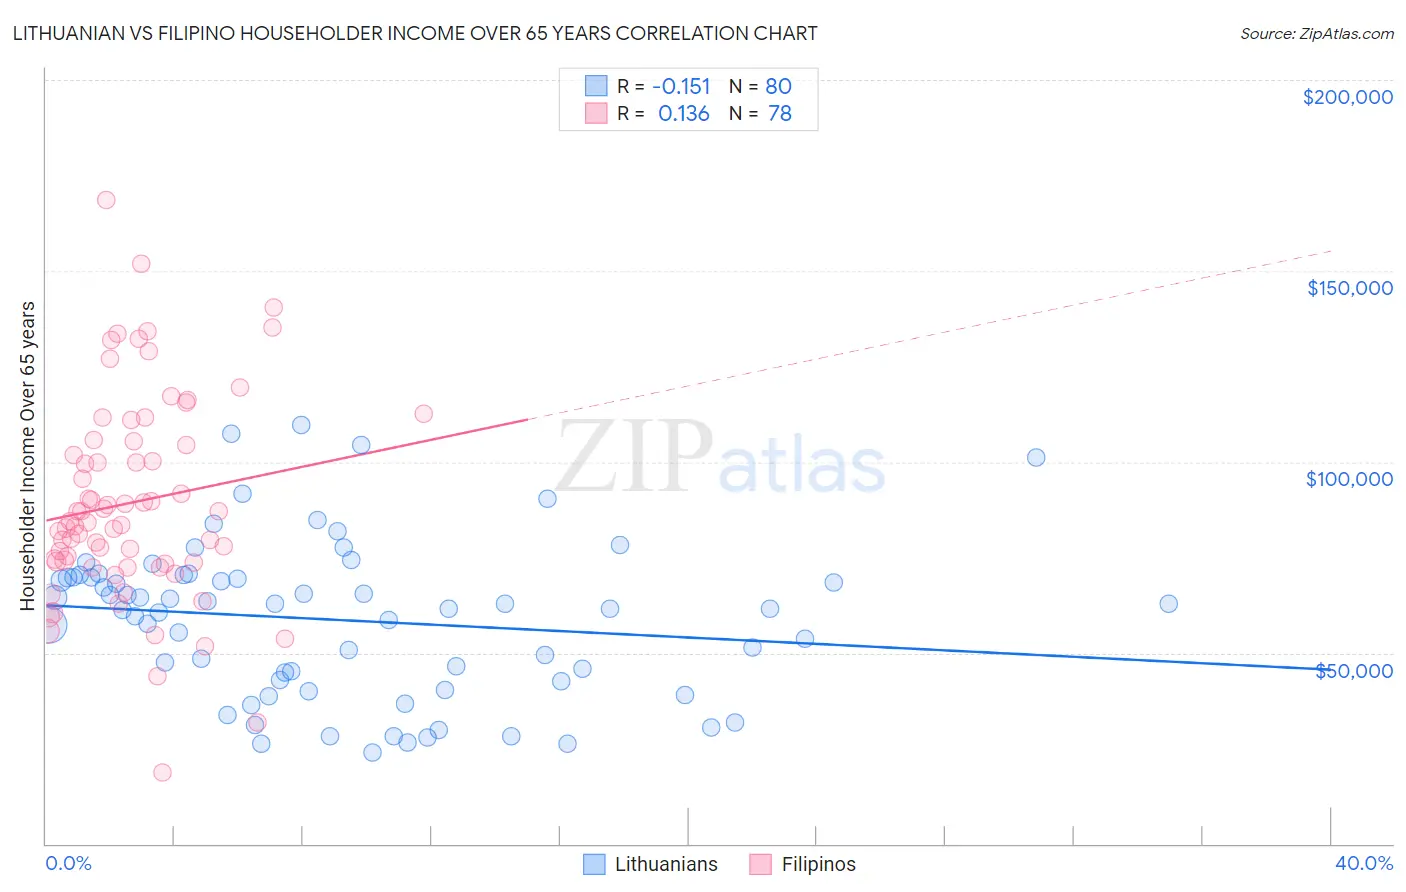
Lithuanian vs Filipino Householder Income Over 65 years Correlation Chart
The statistical analysis conducted on geographies consisting of 420,649,673 people shows a poor negative correlation between the proportion of Lithuanians and household income with householder over the age of 65 in the United States with a correlation coefficient (R) of -0.151 and weighted average of $65,209. Similarly, the statistical analysis conducted on geographies consisting of 253,664,228 people shows a poor positive correlation between the proportion of Filipinos and household income with householder over the age of 65 in the United States with a correlation coefficient (R) of 0.136 and weighted average of $76,686, a difference of 17.6%.
Householder Income Over 65 years Correlation Summary
| Measurement | Lithuanian | Filipino |
| Minimum | $23,920 | $18,667 |
| Maximum | $109,815 | $168,449 |
| Range | $85,895 | $149,782 |
| Mean | $58,554 | $89,373 |
| Median | $61,584 | $84,207 |
| Interquartile 25% (IQ1) | $42,717 | $73,750 |
| Interquartile 75% (IQ3) | $69,714 | $105,277 |
| Interquartile Range (IQR) | $26,997 | $31,527 |
| Standard Deviation (Sample) | $20,286 | $26,949 |
| Standard Deviation (Population) | $20,159 | $26,776 |
Similar Demographics by Householder Income Over 65 years
Demographics Similar to Lithuanians by Householder Income Over 65 years
In terms of householder income over 65 years, the demographic groups most similar to Lithuanians are Immigrants from Ethiopia ($65,238, a difference of 0.040%), Argentinean ($65,246, a difference of 0.060%), Greek ($65,306, a difference of 0.15%), Mongolian ($65,326, a difference of 0.18%), and Sierra Leonean ($65,038, a difference of 0.26%).
| Demographics | Rating | Rank | Householder Income Over 65 years |
| Immigrants | Malaysia | 99.1 /100 | #67 | Exceptional $65,497 |
| Egyptians | 99.1 /100 | #68 | Exceptional $65,441 |
| Samoans | 99.1 /100 | #69 | Exceptional $65,427 |
| Mongolians | 99.0 /100 | #70 | Exceptional $65,326 |
| Greeks | 98.9 /100 | #71 | Exceptional $65,306 |
| Argentineans | 98.9 /100 | #72 | Exceptional $65,246 |
| Immigrants | Ethiopia | 98.9 /100 | #73 | Exceptional $65,238 |
| Lithuanians | 98.8 /100 | #74 | Exceptional $65,209 |
| Sierra Leoneans | 98.6 /100 | #75 | Exceptional $65,038 |
| Ethiopians | 98.5 /100 | #76 | Exceptional $64,989 |
| Immigrants | Canada | 98.5 /100 | #77 | Exceptional $64,952 |
| Immigrants | Western Europe | 98.5 /100 | #78 | Exceptional $64,933 |
| Hawaiians | 98.4 /100 | #79 | Exceptional $64,920 |
| Immigrants | North America | 98.3 /100 | #80 | Exceptional $64,856 |
| Immigrants | Europe | 98.3 /100 | #81 | Exceptional $64,828 |
Demographics Similar to Filipinos by Householder Income Over 65 years
In terms of householder income over 65 years, the demographic groups most similar to Filipinos are Immigrants from Taiwan ($77,051, a difference of 0.48%), Iranian ($77,429, a difference of 0.97%), Chinese ($77,465, a difference of 1.0%), Immigrants from Iran ($75,081, a difference of 2.1%), and Bolivian ($74,245, a difference of 3.3%).
| Demographics | Rating | Rank | Householder Income Over 65 years |
| Chinese | 100.0 /100 | #1 | Exceptional $77,465 |
| Iranians | 100.0 /100 | #2 | Exceptional $77,429 |
| Immigrants | Taiwan | 100.0 /100 | #3 | Exceptional $77,051 |
| Filipinos | 100.0 /100 | #4 | Exceptional $76,686 |
| Immigrants | Iran | 100.0 /100 | #5 | Exceptional $75,081 |
| Bolivians | 100.0 /100 | #6 | Exceptional $74,245 |
| Immigrants | Bolivia | 100.0 /100 | #7 | Exceptional $73,434 |
| Immigrants | Singapore | 100.0 /100 | #8 | Exceptional $72,963 |
| Immigrants | India | 100.0 /100 | #9 | Exceptional $72,804 |
| Bhutanese | 100.0 /100 | #10 | Exceptional $72,288 |
| Thais | 100.0 /100 | #11 | Exceptional $72,099 |
| Cypriots | 100.0 /100 | #12 | Exceptional $71,714 |
| Immigrants | Hong Kong | 100.0 /100 | #13 | Exceptional $71,567 |
| Burmese | 100.0 /100 | #14 | Exceptional $71,139 |
| Native Hawaiians | 100.0 /100 | #15 | Exceptional $71,021 |