Liberian vs Immigrants from Taiwan Householder Income Under 25 years
COMPARE
Liberian
Immigrants from Taiwan
Householder Income Under 25 years
Householder Income Under 25 years Comparison
Liberians
Immigrants from Taiwan
$48,917
HOUSEHOLDER INCOME UNDER 25 YEARS
0.0/ 100
METRIC RATING
288th/ 347
METRIC RANK
$59,424
HOUSEHOLDER INCOME UNDER 25 YEARS
100.0/ 100
METRIC RATING
4th/ 347
METRIC RANK
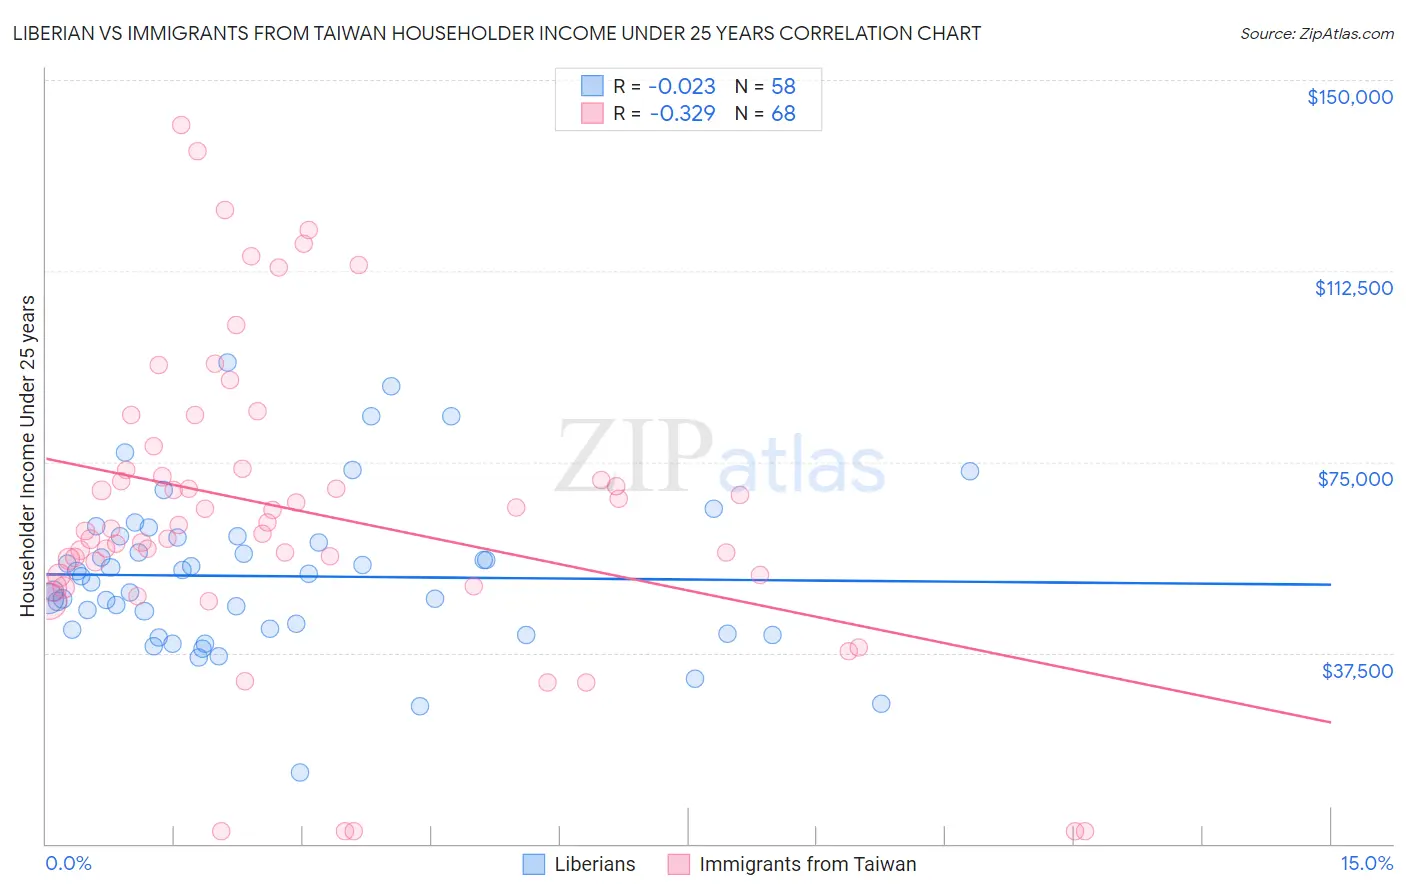
Liberian vs Immigrants from Taiwan Householder Income Under 25 years Correlation Chart
The statistical analysis conducted on geographies consisting of 110,653,679 people shows no correlation between the proportion of Liberians and household income with householder under the age of 25 in the United States with a correlation coefficient (R) of -0.023 and weighted average of $48,917. Similarly, the statistical analysis conducted on geographies consisting of 256,317,565 people shows a mild negative correlation between the proportion of Immigrants from Taiwan and household income with householder under the age of 25 in the United States with a correlation coefficient (R) of -0.329 and weighted average of $59,424, a difference of 21.5%.
Householder Income Under 25 years Correlation Summary
| Measurement | Liberian | Immigrants from Taiwan |
| Minimum | $13,942 | $2,499 |
| Maximum | $94,479 | $141,202 |
| Range | $80,537 | $138,703 |
| Mean | $52,552 | $65,450 |
| Median | $51,943 | $62,277 |
| Interquartile 25% (IQ1) | $42,067 | $52,778 |
| Interquartile 75% (IQ3) | $60,104 | $73,483 |
| Interquartile Range (IQR) | $18,037 | $20,705 |
| Standard Deviation (Sample) | $15,238 | $29,878 |
| Standard Deviation (Population) | $15,106 | $29,657 |
Similar Demographics by Householder Income Under 25 years
Demographics Similar to Liberians by Householder Income Under 25 years
In terms of householder income under 25 years, the demographic groups most similar to Liberians are Honduran ($48,885, a difference of 0.060%), Senegalese ($48,953, a difference of 0.070%), French American Indian ($48,977, a difference of 0.12%), American ($48,860, a difference of 0.12%), and Scotch-Irish ($49,039, a difference of 0.25%).
| Demographics | Rating | Rank | Householder Income Under 25 years |
| Immigrants | Nonimmigrants | 0.1 /100 | #281 | Tragic $49,348 |
| Alsatians | 0.1 /100 | #282 | Tragic $49,267 |
| Immigrants | Nigeria | 0.1 /100 | #283 | Tragic $49,174 |
| Carpatho Rusyns | 0.1 /100 | #284 | Tragic $49,113 |
| Scotch-Irish | 0.0 /100 | #285 | Tragic $49,039 |
| French American Indians | 0.0 /100 | #286 | Tragic $48,977 |
| Senegalese | 0.0 /100 | #287 | Tragic $48,953 |
| Liberians | 0.0 /100 | #288 | Tragic $48,917 |
| Hondurans | 0.0 /100 | #289 | Tragic $48,885 |
| Americans | 0.0 /100 | #290 | Tragic $48,860 |
| Immigrants | Burma/Myanmar | 0.0 /100 | #291 | Tragic $48,749 |
| Shoshone | 0.0 /100 | #292 | Tragic $48,720 |
| Sub-Saharan Africans | 0.0 /100 | #293 | Tragic $48,691 |
| Somalis | 0.0 /100 | #294 | Tragic $48,657 |
| Central American Indians | 0.0 /100 | #295 | Tragic $48,643 |
Demographics Similar to Immigrants from Taiwan by Householder Income Under 25 years
In terms of householder income under 25 years, the demographic groups most similar to Immigrants from Taiwan are Immigrants from Bolivia ($59,389, a difference of 0.060%), Thai ($59,187, a difference of 0.40%), Immigrants from India ($59,914, a difference of 0.82%), Bolivian ($58,506, a difference of 1.6%), and Indian (Asian) ($58,239, a difference of 2.0%).
| Demographics | Rating | Rank | Householder Income Under 25 years |
| Assyrians/Chaldeans/Syriacs | 100.0 /100 | #1 | Exceptional $65,329 |
| Immigrants | Hong Kong | 100.0 /100 | #2 | Exceptional $62,083 |
| Immigrants | India | 100.0 /100 | #3 | Exceptional $59,914 |
| Immigrants | Taiwan | 100.0 /100 | #4 | Exceptional $59,424 |
| Immigrants | Bolivia | 100.0 /100 | #5 | Exceptional $59,389 |
| Thais | 100.0 /100 | #6 | Exceptional $59,187 |
| Bolivians | 100.0 /100 | #7 | Exceptional $58,506 |
| Indians (Asian) | 100.0 /100 | #8 | Exceptional $58,239 |
| Chinese | 100.0 /100 | #9 | Exceptional $58,162 |
| Afghans | 100.0 /100 | #10 | Exceptional $58,019 |
| Immigrants | China | 100.0 /100 | #11 | Exceptional $57,931 |
| Immigrants | Philippines | 100.0 /100 | #12 | Exceptional $57,930 |
| Immigrants | South Central Asia | 100.0 /100 | #13 | Exceptional $57,818 |
| Filipinos | 100.0 /100 | #14 | Exceptional $57,740 |
| Koreans | 100.0 /100 | #15 | Exceptional $57,730 |