Lebanese vs Belizean Median Male Earnings
COMPARE
Lebanese
Belizean
Median Male Earnings
Median Male Earnings Comparison
Lebanese
Belizeans
$57,409
MEDIAN MALE EARNINGS
94.6/ 100
METRIC RATING
116th/ 347
METRIC RANK
$48,358
MEDIAN MALE EARNINGS
0.2/ 100
METRIC RATING
277th/ 347
METRIC RANK
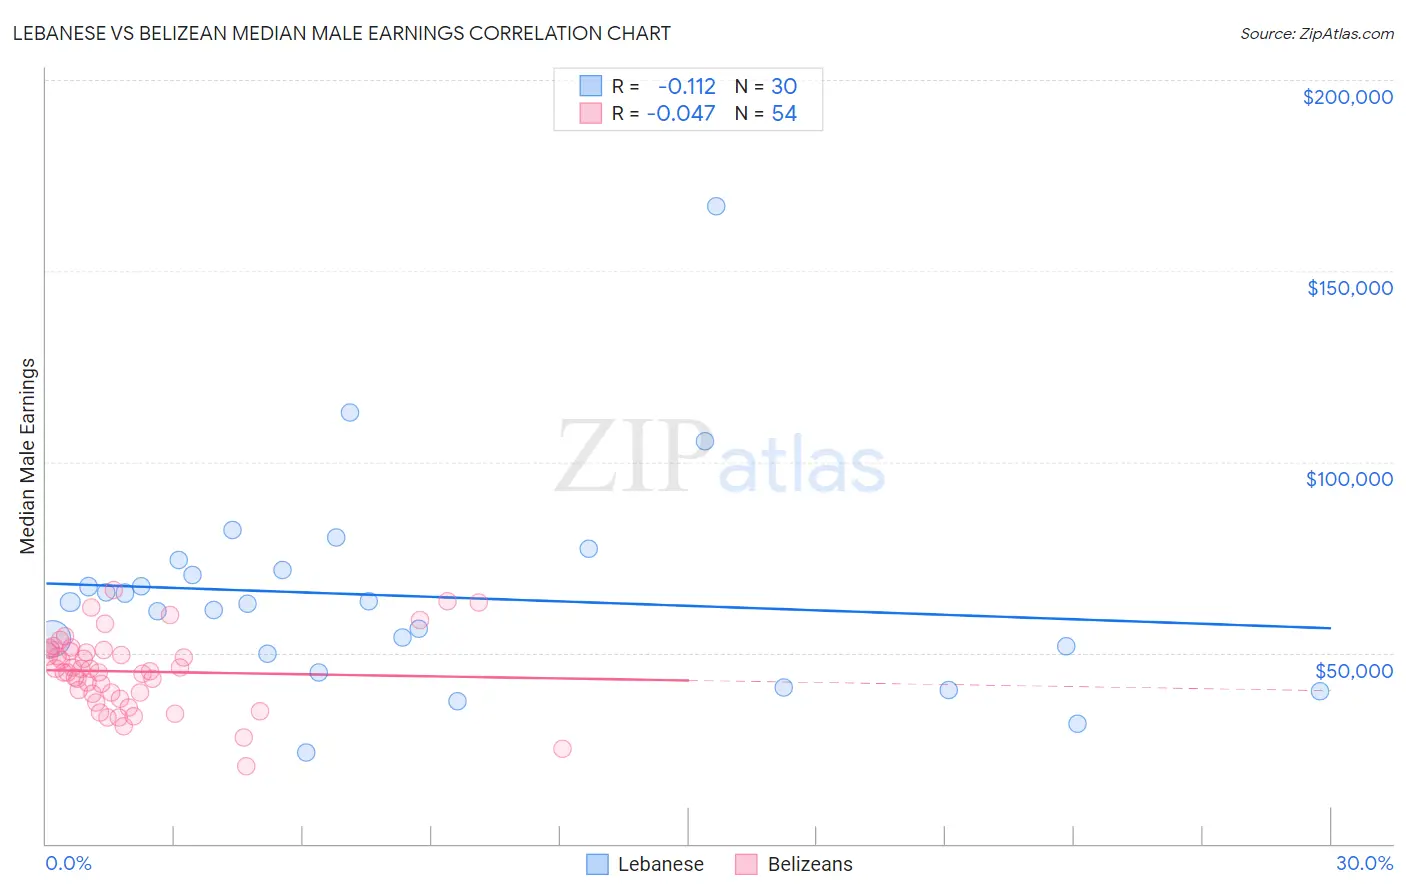
Lebanese vs Belizean Median Male Earnings Correlation Chart
The statistical analysis conducted on geographies consisting of 401,493,865 people shows a poor negative correlation between the proportion of Lebanese and median male earnings in the United States with a correlation coefficient (R) of -0.112 and weighted average of $57,409. Similarly, the statistical analysis conducted on geographies consisting of 144,207,760 people shows no correlation between the proportion of Belizeans and median male earnings in the United States with a correlation coefficient (R) of -0.047 and weighted average of $48,358, a difference of 18.7%.
Median Male Earnings Correlation Summary
| Measurement | Lebanese | Belizean |
| Minimum | $23,959 | $20,292 |
| Maximum | $167,014 | $66,580 |
| Range | $143,055 | $46,288 |
| Mean | $64,779 | $45,078 |
| Median | $62,976 | $45,641 |
| Interquartile 25% (IQ1) | $49,621 | $39,349 |
| Interquartile 75% (IQ3) | $71,843 | $50,831 |
| Interquartile Range (IQR) | $22,221 | $11,482 |
| Standard Deviation (Sample) | $27,382 | $9,817 |
| Standard Deviation (Population) | $26,922 | $9,725 |
Similar Demographics by Median Male Earnings
Demographics Similar to Lebanese by Median Male Earnings
In terms of median male earnings, the demographic groups most similar to Lebanese are Swedish ($57,445, a difference of 0.060%), Immigrants from Zimbabwe ($57,352, a difference of 0.10%), Hungarian ($57,309, a difference of 0.18%), Arab ($57,298, a difference of 0.19%), and Canadian ($57,286, a difference of 0.22%).
| Demographics | Rating | Rank | Median Male Earnings |
| British | 96.5 /100 | #109 | Exceptional $57,890 |
| Palestinians | 96.2 /100 | #110 | Exceptional $57,778 |
| Europeans | 95.6 /100 | #111 | Exceptional $57,637 |
| Immigrants | Afghanistan | 95.4 /100 | #112 | Exceptional $57,582 |
| Carpatho Rusyns | 95.3 /100 | #113 | Exceptional $57,572 |
| Immigrants | Kuwait | 95.3 /100 | #114 | Exceptional $57,562 |
| Swedes | 94.8 /100 | #115 | Exceptional $57,445 |
| Lebanese | 94.6 /100 | #116 | Exceptional $57,409 |
| Immigrants | Zimbabwe | 94.3 /100 | #117 | Exceptional $57,352 |
| Hungarians | 94.0 /100 | #118 | Exceptional $57,309 |
| Arabs | 94.0 /100 | #119 | Exceptional $57,298 |
| Canadians | 93.9 /100 | #120 | Exceptional $57,286 |
| Immigrants | Albania | 93.3 /100 | #121 | Exceptional $57,179 |
| Immigrants | Jordan | 93.1 /100 | #122 | Exceptional $57,145 |
| Slovenes | 93.1 /100 | #123 | Exceptional $57,145 |
Demographics Similar to Belizeans by Median Male Earnings
In terms of median male earnings, the demographic groups most similar to Belizeans are Immigrants from Liberia ($48,317, a difference of 0.080%), Blackfeet ($48,402, a difference of 0.090%), Immigrants from Somalia ($48,439, a difference of 0.17%), Hmong ($48,254, a difference of 0.22%), and Comanche ($48,202, a difference of 0.32%).
| Demographics | Rating | Rank | Median Male Earnings |
| Potawatomi | 0.4 /100 | #270 | Tragic $48,768 |
| Cherokee | 0.3 /100 | #271 | Tragic $48,669 |
| Salvadorans | 0.3 /100 | #272 | Tragic $48,646 |
| Jamaicans | 0.3 /100 | #273 | Tragic $48,632 |
| Colville | 0.3 /100 | #274 | Tragic $48,516 |
| Immigrants | Somalia | 0.3 /100 | #275 | Tragic $48,439 |
| Blackfeet | 0.3 /100 | #276 | Tragic $48,402 |
| Belizeans | 0.2 /100 | #277 | Tragic $48,358 |
| Immigrants | Liberia | 0.2 /100 | #278 | Tragic $48,317 |
| Hmong | 0.2 /100 | #279 | Tragic $48,254 |
| Comanche | 0.2 /100 | #280 | Tragic $48,202 |
| Marshallese | 0.2 /100 | #281 | Tragic $48,137 |
| Central Americans | 0.2 /100 | #282 | Tragic $48,093 |
| Immigrants | Jamaica | 0.2 /100 | #283 | Tragic $48,040 |
| Africans | 0.2 /100 | #284 | Tragic $47,994 |