Latvian vs Immigrants from Somalia Median Male Earnings
COMPARE
Latvian
Immigrants from Somalia
Median Male Earnings
Median Male Earnings Comparison
Latvians
Immigrants from Somalia
$63,498
MEDIAN MALE EARNINGS
100.0/ 100
METRIC RATING
31st/ 347
METRIC RANK
$48,439
MEDIAN MALE EARNINGS
0.3/ 100
METRIC RATING
275th/ 347
METRIC RANK
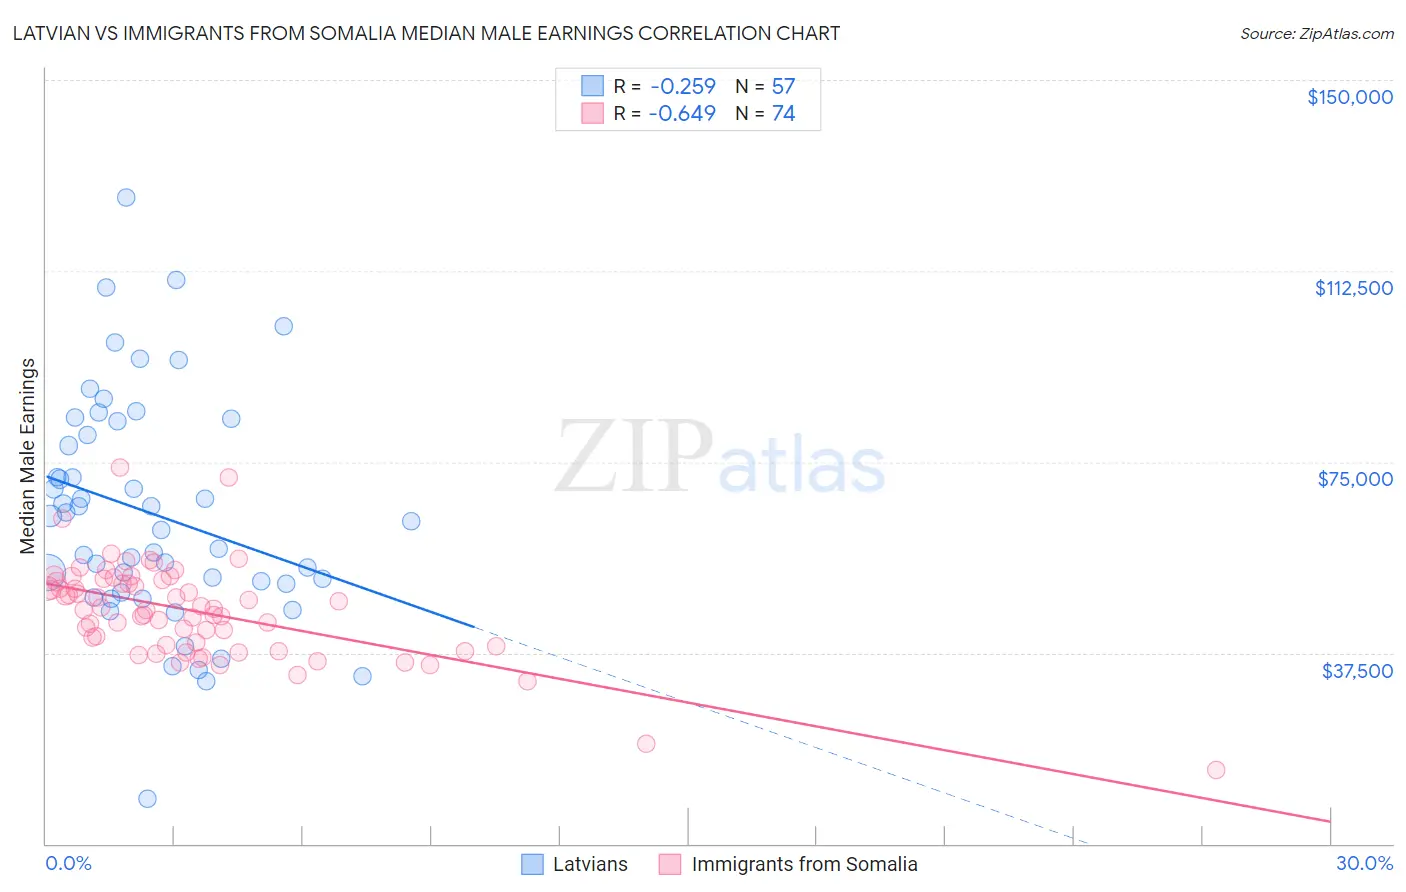
Latvian vs Immigrants from Somalia Median Male Earnings Correlation Chart
The statistical analysis conducted on geographies consisting of 220,682,058 people shows a weak negative correlation between the proportion of Latvians and median male earnings in the United States with a correlation coefficient (R) of -0.259 and weighted average of $63,498. Similarly, the statistical analysis conducted on geographies consisting of 92,109,982 people shows a significant negative correlation between the proportion of Immigrants from Somalia and median male earnings in the United States with a correlation coefficient (R) of -0.649 and weighted average of $48,439, a difference of 31.1%.
Median Male Earnings Correlation Summary
| Measurement | Latvian | Immigrants from Somalia |
| Minimum | $8,856 | $14,382 |
| Maximum | $126,871 | $73,796 |
| Range | $118,015 | $59,414 |
| Mean | $64,757 | $45,683 |
| Median | $63,438 | $46,151 |
| Interquartile 25% (IQ1) | $50,186 | $39,154 |
| Interquartile 75% (IQ3) | $81,584 | $51,463 |
| Interquartile Range (IQR) | $31,398 | $12,309 |
| Standard Deviation (Sample) | $22,394 | $9,409 |
| Standard Deviation (Population) | $22,197 | $9,346 |
Similar Demographics by Median Male Earnings
Demographics Similar to Latvians by Median Male Earnings
In terms of median male earnings, the demographic groups most similar to Latvians are Soviet Union ($63,382, a difference of 0.18%), Immigrants from Lithuania ($63,346, a difference of 0.24%), Immigrants from Russia ($63,326, a difference of 0.27%), Immigrants from France ($63,715, a difference of 0.34%), and Immigrants from Asia ($63,240, a difference of 0.41%).
| Demographics | Rating | Rank | Median Male Earnings |
| Immigrants | Northern Europe | 100.0 /100 | #24 | Exceptional $64,987 |
| Immigrants | Denmark | 100.0 /100 | #25 | Exceptional $64,625 |
| Turks | 100.0 /100 | #26 | Exceptional $64,253 |
| Immigrants | Switzerland | 100.0 /100 | #27 | Exceptional $63,944 |
| Russians | 100.0 /100 | #28 | Exceptional $63,939 |
| Asians | 100.0 /100 | #29 | Exceptional $63,827 |
| Immigrants | France | 100.0 /100 | #30 | Exceptional $63,715 |
| Latvians | 100.0 /100 | #31 | Exceptional $63,498 |
| Soviet Union | 100.0 /100 | #32 | Exceptional $63,382 |
| Immigrants | Lithuania | 100.0 /100 | #33 | Exceptional $63,346 |
| Immigrants | Russia | 100.0 /100 | #34 | Exceptional $63,326 |
| Immigrants | Asia | 100.0 /100 | #35 | Exceptional $63,240 |
| Israelis | 100.0 /100 | #36 | Exceptional $63,228 |
| Immigrants | Sri Lanka | 100.0 /100 | #37 | Exceptional $63,099 |
| Maltese | 100.0 /100 | #38 | Exceptional $62,953 |
Demographics Similar to Immigrants from Somalia by Median Male Earnings
In terms of median male earnings, the demographic groups most similar to Immigrants from Somalia are Blackfeet ($48,402, a difference of 0.080%), Colville ($48,516, a difference of 0.16%), Belizean ($48,358, a difference of 0.17%), Immigrants from Liberia ($48,317, a difference of 0.25%), and Hmong ($48,254, a difference of 0.38%).
| Demographics | Rating | Rank | Median Male Earnings |
| Ute | 0.4 /100 | #268 | Tragic $48,899 |
| Tsimshian | 0.4 /100 | #269 | Tragic $48,836 |
| Potawatomi | 0.4 /100 | #270 | Tragic $48,768 |
| Cherokee | 0.3 /100 | #271 | Tragic $48,669 |
| Salvadorans | 0.3 /100 | #272 | Tragic $48,646 |
| Jamaicans | 0.3 /100 | #273 | Tragic $48,632 |
| Colville | 0.3 /100 | #274 | Tragic $48,516 |
| Immigrants | Somalia | 0.3 /100 | #275 | Tragic $48,439 |
| Blackfeet | 0.3 /100 | #276 | Tragic $48,402 |
| Belizeans | 0.2 /100 | #277 | Tragic $48,358 |
| Immigrants | Liberia | 0.2 /100 | #278 | Tragic $48,317 |
| Hmong | 0.2 /100 | #279 | Tragic $48,254 |
| Comanche | 0.2 /100 | #280 | Tragic $48,202 |
| Marshallese | 0.2 /100 | #281 | Tragic $48,137 |
| Central Americans | 0.2 /100 | #282 | Tragic $48,093 |