Jordanian vs Immigrants from Bolivia Median Household Income
COMPARE
Jordanian
Immigrants from Bolivia
Median Household Income
Median Household Income Comparison
Jordanians
Immigrants from Bolivia
$91,794
MEDIAN HOUSEHOLD INCOME
98.7/ 100
METRIC RATING
96th/ 347
METRIC RANK
$101,394
MEDIAN HOUSEHOLD INCOME
100.0/ 100
METRIC RATING
23rd/ 347
METRIC RANK
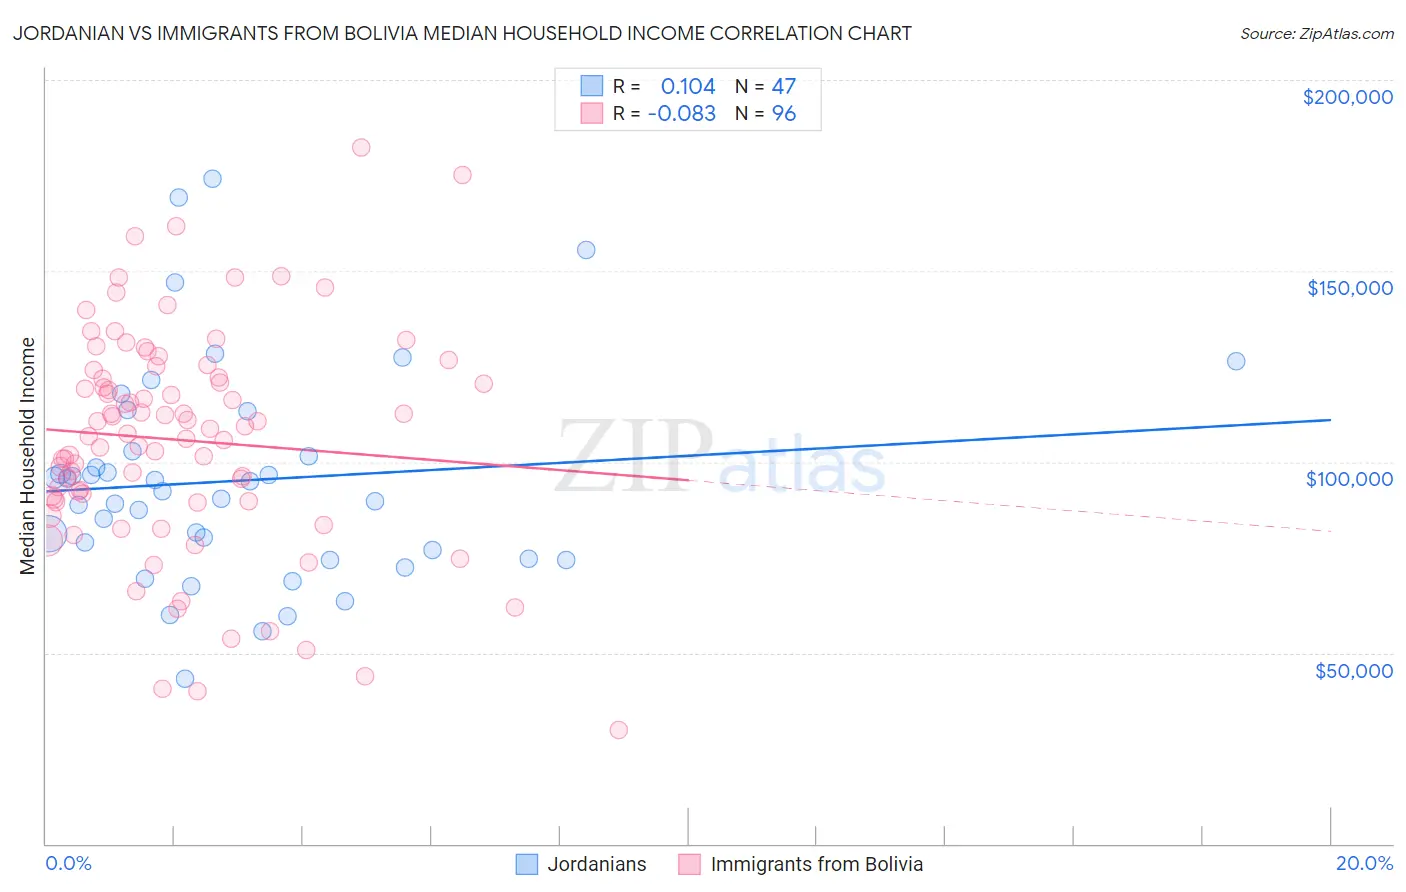
Jordanian vs Immigrants from Bolivia Median Household Income Correlation Chart
The statistical analysis conducted on geographies consisting of 166,374,087 people shows a poor positive correlation between the proportion of Jordanians and median household income in the United States with a correlation coefficient (R) of 0.104 and weighted average of $91,794. Similarly, the statistical analysis conducted on geographies consisting of 158,713,567 people shows a slight negative correlation between the proportion of Immigrants from Bolivia and median household income in the United States with a correlation coefficient (R) of -0.083 and weighted average of $101,394, a difference of 10.5%.
Median Household Income Correlation Summary
| Measurement | Jordanian | Immigrants from Bolivia |
| Minimum | $43,214 | $29,844 |
| Maximum | $174,260 | $182,250 |
| Range | $131,046 | $152,406 |
| Mean | $95,049 | $105,682 |
| Median | $92,429 | $107,900 |
| Interquartile 25% (IQ1) | $74,643 | $89,971 |
| Interquartile 75% (IQ3) | $102,895 | $123,106 |
| Interquartile Range (IQR) | $28,252 | $33,135 |
| Standard Deviation (Sample) | $28,123 | $29,190 |
| Standard Deviation (Population) | $27,822 | $29,037 |
Similar Demographics by Median Household Income
Demographics Similar to Jordanians by Median Household Income
In terms of median household income, the demographic groups most similar to Jordanians are Armenian ($91,807, a difference of 0.010%), Immigrants from North America ($91,860, a difference of 0.070%), Immigrants from Serbia ($91,730, a difference of 0.070%), Immigrants from Lebanon ($91,887, a difference of 0.10%), and Immigrants from Western Europe ($91,936, a difference of 0.15%).
| Demographics | Rating | Rank | Median Household Income |
| Romanians | 98.8 /100 | #89 | Exceptional $91,994 |
| Assyrians/Chaldeans/Syriacs | 98.8 /100 | #90 | Exceptional $91,991 |
| Immigrants | Vietnam | 98.8 /100 | #91 | Exceptional $91,987 |
| Immigrants | Western Europe | 98.8 /100 | #92 | Exceptional $91,936 |
| Immigrants | Lebanon | 98.7 /100 | #93 | Exceptional $91,887 |
| Immigrants | North America | 98.7 /100 | #94 | Exceptional $91,860 |
| Armenians | 98.7 /100 | #95 | Exceptional $91,807 |
| Jordanians | 98.7 /100 | #96 | Exceptional $91,794 |
| Immigrants | Serbia | 98.6 /100 | #97 | Exceptional $91,730 |
| Immigrants | Southern Europe | 98.5 /100 | #98 | Exceptional $91,605 |
| Immigrants | South Eastern Asia | 98.4 /100 | #99 | Exceptional $91,541 |
| Ukrainians | 98.3 /100 | #100 | Exceptional $91,456 |
| Immigrants | Moldova | 98.3 /100 | #101 | Exceptional $91,446 |
| Austrians | 98.2 /100 | #102 | Exceptional $91,339 |
| Immigrants | Ukraine | 98.0 /100 | #103 | Exceptional $91,124 |
Demographics Similar to Immigrants from Bolivia by Median Household Income
In terms of median household income, the demographic groups most similar to Immigrants from Bolivia are Asian ($101,681, a difference of 0.28%), Eastern European ($101,781, a difference of 0.38%), Immigrants from Japan ($100,711, a difference of 0.68%), Immigrants from Sweden ($100,699, a difference of 0.69%), and Bolivian ($102,195, a difference of 0.79%).
| Demographics | Rating | Rank | Median Household Income |
| Burmese | 100.0 /100 | #16 | Exceptional $103,145 |
| Immigrants | Korea | 100.0 /100 | #17 | Exceptional $102,962 |
| Cypriots | 100.0 /100 | #18 | Exceptional $102,843 |
| Immigrants | Australia | 100.0 /100 | #19 | Exceptional $102,562 |
| Bolivians | 100.0 /100 | #20 | Exceptional $102,195 |
| Eastern Europeans | 100.0 /100 | #21 | Exceptional $101,781 |
| Asians | 100.0 /100 | #22 | Exceptional $101,681 |
| Immigrants | Bolivia | 100.0 /100 | #23 | Exceptional $101,394 |
| Immigrants | Japan | 100.0 /100 | #24 | Exceptional $100,711 |
| Immigrants | Sweden | 100.0 /100 | #25 | Exceptional $100,699 |
| Immigrants | Belgium | 100.0 /100 | #26 | Exceptional $100,306 |
| Bhutanese | 100.0 /100 | #27 | Exceptional $100,151 |
| Immigrants | Sri Lanka | 100.0 /100 | #28 | Exceptional $99,943 |
| Immigrants | Asia | 100.0 /100 | #29 | Exceptional $99,933 |
| Immigrants | Northern Europe | 100.0 /100 | #30 | Exceptional $99,813 |