Jamaican vs Swedish Median Household Income

COMPARE

Jamaican
Race
Ancestry
AfghanAfricanAlaska NativeAlaskan AthabascanAlbanianAleutAlsatianAmericanApacheArabArapahoArgentineanArmenianAssyrian/Chaldean/SyriacAustralianAustrianBahamianBangladeshiBarbadianBasqueBelgianBelizeanBermudanBhutaneseBlackfeetBolivianBrazilianBritishBritish West IndianBulgarianBurmeseCajunCambodianCanadianCape VerdeanCarpatho RusynCelticCentral AmericanCentral American IndianCherokeeCheyenneChickasawChileanChineseChippewaChoctawColombianColvilleComancheCosta RicanCreeCreekCroatianCrowCubanCypriotCzechCzechoslovakianDanishDelawareDominicanDutchDutch West IndianEastern EuropeanEcuadorianEgyptianEnglishEstonianEthiopianEuropeanFijianFilipinoFinnishFrenchFrench American IndianFrench CanadianGermanGerman RussianGhanaianGreekGuamanian/ChamorroGuatemalanGuyaneseHaitianHmongHonduranHopiHoumaHungarianIcelanderIndian (Asian)IndonesianInupiatIranianIraqiIrishIroquoisIsraeliItalianJamaicanJapaneseJordanianKenyanKiowaKoreanLaotianLatvianLebaneseLiberianLithuanianLumbeeLuxembourgerMacedonianMalaysianMalteseMarshalleseMenomineeMexicanMexican American IndianMongolianMoroccanNative HawaiianNavajoNepaleseNew ZealanderNicaraguanNigerianNorthern EuropeanNorwegianOkinawanOsageOttawaPaiutePakistaniPalestinianPanamanianParaguayanPennsylvania GermanPeruvianPimaPolishPortuguesePotawatomiPuebloPuerto RicanPuget Sound SalishRomanianRussianSalvadoranSamoanScandinavianScotch-IrishScottishSeminoleSenegaleseSerbianShoshoneSierra LeoneanSiouxSlavicSlovakSloveneSomaliSouth AfricanSouth AmericanSouth American IndianSoviet UnionSpaniardSpanishSpanish AmericanSpanish American IndianSri LankanSubsaharan AfricanSudaneseSwissSyrianTaiwaneseThaiTlingit-HaidaTohono O'OdhamTonganTrinidadian and TobagonianTsimshianTurkishU.S. Virgin IslanderUgandanUkrainianUruguayanUteVenezuelanVietnameseWelshWest IndianYakamaYaquiYugoslavianYumanYup'ikZimbabwean
Immigration
NonimmigrantsImmigrantsAfghanistanAfricaAlbaniaArgentinaArmeniaAsiaAustraliaAustriaBahamasBangladeshBarbadosBelarusBelgiumBelizeBoliviaBosnia and HerzegovinaBrazilBulgariaBurma/MyanmarCabo VerdeCambodiaCameroonCanadaCaribbeanCentral AmericaChileChinaColombiaCongoCosta RicaCroatiaCubaCzechoslovakiaDenmarkDominicaDominican RepublicEastern AfricaEastern AsiaEastern EuropeEcuadorEgyptEl SalvadorEnglandEritreaEthiopiaEuropeFijiFranceGermanyGhanaGreeceGrenadaGuatemalaGuyanaHaitiHondurasHong KongHungaryIndiaIndonesiaIranIraqIrelandIsraelItalyJamaicaJapanJordanKazakhstanKenyaKoreaKuwaitLaosLatin AmericaLatviaLebanonLiberiaLithuaniaMalaysiaMexicoMicronesiaMiddle AfricaMoldovaMoroccoNepalNetherlandsNicaraguaNigeriaNorth AmericaNorth MacedoniaNorthern AfricaNorthern EuropeNorwayOceaniaPakistanPanamaPeruPhilippinesPolandPortugalRomaniaRussiaSaudi ArabiaScotlandSenegalSerbiaSierra LeoneSingaporeSomaliaSouth AfricaSouth AmericaSouth Central AsiaSouth Eastern AsiaSouthern EuropeSpainSri LankaSt. Vincent and the GrenadinesSudanSwedenSwitzerlandSyriaTaiwanThailandTrinidad and TobagoTurkeyUgandaUkraineUruguayUzbekistanVenezuelaVietnamWest IndiesWestern AfricaWestern AsiaWestern EuropeYemenZaireZimbabweAzores
Swedish
Race
Ancestry
AfghanAfricanAlaska NativeAlaskan AthabascanAlbanianAleutAlsatianAmericanApacheArabArapahoArgentineanArmenianAssyrian/Chaldean/SyriacAustralianAustrianBahamianBangladeshiBarbadianBasqueBelgianBelizeanBermudanBhutaneseBlackfeetBolivianBrazilianBritishBritish West IndianBulgarianBurmeseCajunCambodianCanadianCape VerdeanCarpatho RusynCelticCentral AmericanCentral American IndianCherokeeCheyenneChickasawChileanChineseChippewaChoctawColombianColvilleComancheCosta RicanCreeCreekCroatianCrowCubanCypriotCzechCzechoslovakianDanishDelawareDominicanDutchDutch West IndianEastern EuropeanEcuadorianEgyptianEnglishEstonianEthiopianEuropeanFijianFilipinoFinnishFrenchFrench American IndianFrench CanadianGermanGerman RussianGhanaianGreekGuamanian/ChamorroGuatemalanGuyaneseHaitianHmongHonduranHopiHoumaHungarianIcelanderIndian (Asian)IndonesianInupiatIranianIraqiIrishIroquoisIsraeliItalianJapaneseJordanianKenyanKiowaKoreanLaotianLatvianLebaneseLiberianLithuanianLumbeeLuxembourgerMacedonianMalaysianMalteseMarshalleseMenomineeMexicanMexican American IndianMongolianMoroccanNative HawaiianNavajoNepaleseNew ZealanderNicaraguanNigerianNorthern EuropeanNorwegianOkinawanOsageOttawaPaiutePakistaniPalestinianPanamanianParaguayanPennsylvania GermanPeruvianPimaPolishPortuguesePotawatomiPuebloPuerto RicanPuget Sound SalishRomanianRussianSalvadoranSamoanScandinavianScotch-IrishScottishSeminoleSenegaleseSerbianShoshoneSierra LeoneanSiouxSlavicSlovakSloveneSomaliSouth AfricanSouth AmericanSouth American IndianSoviet UnionSpaniardSpanishSpanish AmericanSpanish American IndianSri LankanSubsaharan AfricanSudaneseSwedishSwissSyrianTaiwaneseThaiTlingit-HaidaTohono O'OdhamTonganTrinidadian and TobagonianTsimshianTurkishU.S. Virgin IslanderUgandanUkrainianUruguayanUteVenezuelanVietnameseWelshWest IndianYakamaYaquiYugoslavianYumanYup'ikZimbabwean
Immigration
NonimmigrantsImmigrantsAfghanistanAfricaAlbaniaArgentinaArmeniaAsiaAustraliaAustriaBahamasBangladeshBarbadosBelarusBelgiumBelizeBoliviaBosnia and HerzegovinaBrazilBulgariaBurma/MyanmarCabo VerdeCambodiaCameroonCanadaCaribbeanCentral AmericaChileChinaColombiaCongoCosta RicaCroatiaCubaCzechoslovakiaDenmarkDominicaDominican RepublicEastern AfricaEastern AsiaEastern EuropeEcuadorEgyptEl SalvadorEnglandEritreaEthiopiaEuropeFijiFranceGermanyGhanaGreeceGrenadaGuatemalaGuyanaHaitiHondurasHong KongHungaryIndiaIndonesiaIranIraqIrelandIsraelItalyJamaicaJapanJordanKazakhstanKenyaKoreaKuwaitLaosLatin AmericaLatviaLebanonLiberiaLithuaniaMalaysiaMexicoMicronesiaMiddle AfricaMoldovaMoroccoNepalNetherlandsNicaraguaNigeriaNorth AmericaNorth MacedoniaNorthern AfricaNorthern EuropeNorwayOceaniaPakistanPanamaPeruPhilippinesPolandPortugalRomaniaRussiaSaudi ArabiaScotlandSenegalSerbiaSierra LeoneSingaporeSomaliaSouth AfricaSouth AmericaSouth Central AsiaSouth Eastern AsiaSouthern EuropeSpainSri LankaSt. Vincent and the GrenadinesSudanSwedenSwitzerlandSyriaTaiwanThailandTrinidad and TobagoTurkeyUgandaUkraineUruguayUzbekistanVenezuelaVietnamWest IndiesWestern AfricaWestern AsiaWestern EuropeYemenZaireZimbabweAzores
Median Household Income
Income
Poverty
Unemployment
Labor Participation
Family Structure
Vehicle Availability
Education Level
Disability

Median Household Income Comparison

Jamaicans

Swedes

Tragic
Exceptional
$76,583
MEDIAN HOUSEHOLD INCOME
0.4/ 100
METRIC RATING
260th/ 347
METRIC RANK
$88,524
MEDIAN HOUSEHOLD INCOME
90.0/ 100
METRIC RATING
134th/ 347
METRIC RANK

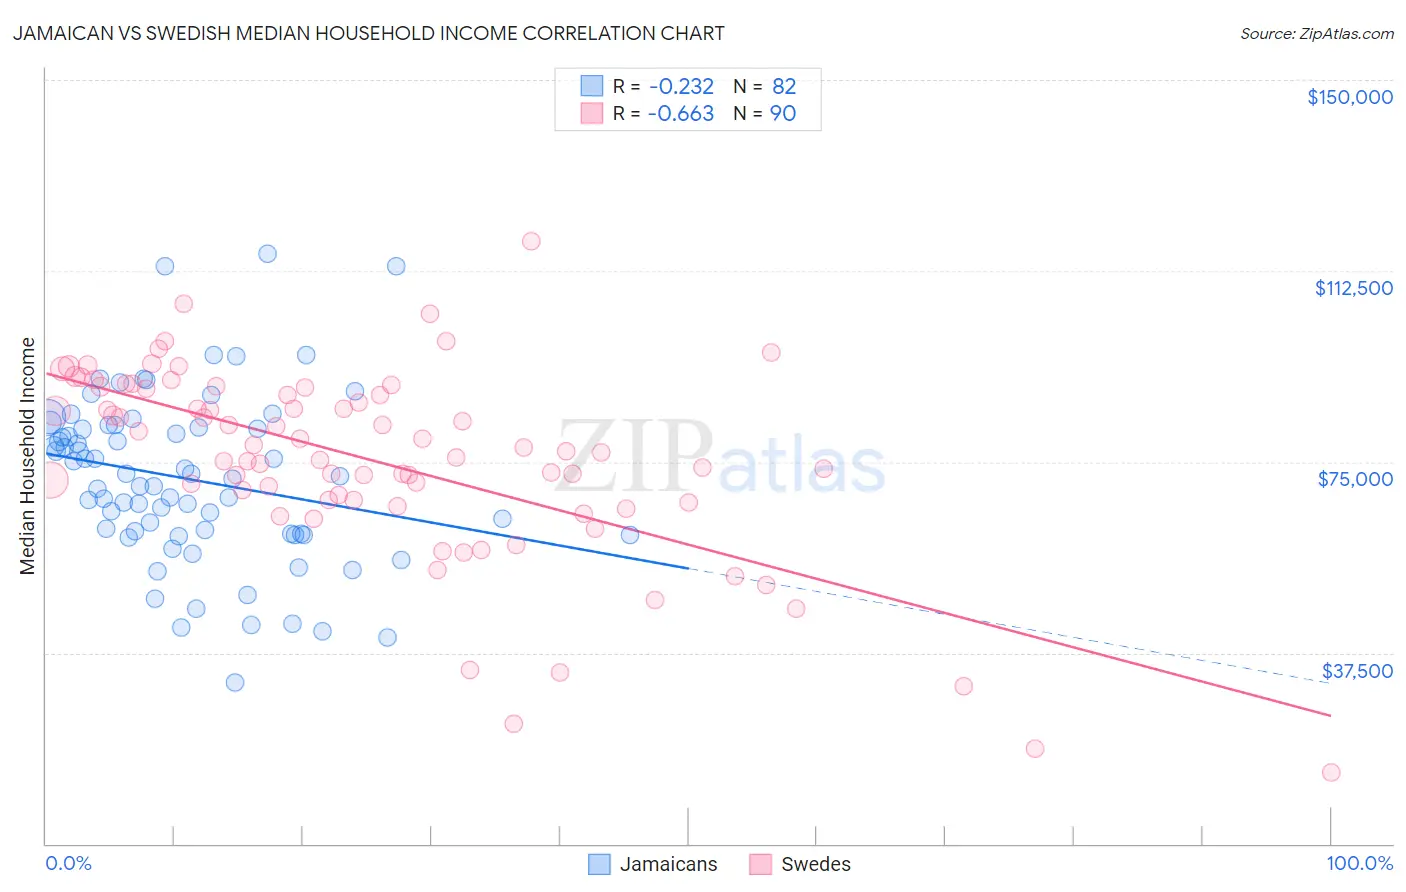
Jamaican vs Swedish Median Household Income Correlation Chart

The statistical analysis conducted on geographies consisting of 367,555,449 people shows a weak negative correlation between the proportion of Jamaicans and median household income in the United States with a correlation coefficient (R) of -0.232 and weighted average of $76,583. Similarly, the statistical analysis conducted on geographies consisting of 538,472,836 people shows a significant negative correlation between the proportion of Swedes and median household income in the United States with a correlation coefficient (R) of -0.663 and weighted average of $88,524, a difference of 15.6%.
Jamaican vs Swedish Median Household Income

Median Household Income Correlation Summary

MeasurementJamaicanSwedish
Minimum$31,580$14,107
Maximum$115,872$118,333
Range$84,292$104,226
Mean$71,605$75,217
Median$71,865$76,969
Interquartile 25% (IQ1)$60,801$67,408
Interquartile 75% (IQ3)$81,812$89,464
Interquartile Range (IQR)$21,011$22,056
Standard Deviation (Sample)$16,569$18,981
Standard Deviation (Population)$16,468$18,875

Similar Demographics by Median Household Income

Demographics Similar to Jamaicans by Median Household Income

In terms of median household income, the demographic groups most similar to Jamaicans are Immigrants from Grenada ($76,517, a difference of 0.090%), Spanish American Indian ($76,670, a difference of 0.11%), Immigrants from Nicaragua ($76,784, a difference of 0.26%), French American Indian ($76,387, a difference of 0.26%), and Alaskan Athabascan ($76,383, a difference of 0.26%).
DemographicsRating | RankMedian Household Income
Immigrants | St. Vincent and the Grenadines
0.9
/100
|
#253
Tragic
$77,690
Sub-Saharan Africans
0.8
/100
|
#254
Tragic
$77,631
Immigrants | Middle Africa
0.8
/100
|
#255
Tragic
$77,559
Belizeans
0.6
/100
|
#256
Tragic
$77,028
Immigrants | Senegal
0.5
/100
|
#257
Tragic
$76,915
Immigrants | Nicaragua
0.5
/100
|
#258
Tragic
$76,784
Spanish American Indians
0.4
/100
|
#259
Tragic
$76,670
Jamaicans
0.4
/100
|
#260
Tragic
$76,583
Immigrants | Grenada
0.4
/100
|
#261
Tragic
$76,517
French American Indians
0.4
/100
|
#262
Tragic
$76,387
Alaskan Athabascans
0.4
/100
|
#263
Tragic
$76,383
Guatemalans
0.3
/100
|
#264
Tragic
$75,961
Immigrants | Belize
0.3
/100
|
#265
Tragic
$75,938
Americans
0.3
/100
|
#266
Tragic
$75,932
German Russians
0.3
/100
|
#267
Tragic
$75,856

Demographics Similar to Swedes by Median Household Income

In terms of median household income, the demographic groups most similar to Swedes are Immigrants from Sierra Leone ($88,498, a difference of 0.030%), Polish ($88,472, a difference of 0.060%), Sierra Leonean ($88,463, a difference of 0.070%), Arab ($88,398, a difference of 0.14%), and Immigrants from Chile ($88,388, a difference of 0.15%).
DemographicsRating | RankMedian Household Income
Immigrants | Peru
92.5
/100
|
#127
Exceptional
$89,010
Portuguese
92.3
/100
|
#128
Exceptional
$88,976
Brazilians
92.1
/100
|
#129
Exceptional
$88,934
British
92.0
/100
|
#130
Exceptional
$88,914
Immigrants | Syria
91.4
/100
|
#131
Exceptional
$88,792
Europeans
91.2
/100
|
#132
Exceptional
$88,751
Immigrants | Ethiopia
90.9
/100
|
#133
Exceptional
$88,687
Swedes
90.0
/100
|
#134
Exceptional
$88,524
Immigrants | Sierra Leone
89.9
/100
|
#135
Excellent
$88,498
Poles
89.7
/100
|
#136
Excellent
$88,472
Sierra Leoneans
89.6
/100
|
#137
Excellent
$88,463
Arabs
89.2
/100
|
#138
Excellent
$88,398
Immigrants | Chile
89.2
/100
|
#139
Excellent
$88,388
Lebanese
87.2
/100
|
#140
Excellent
$88,091
Immigrants | Morocco
86.0
/100
|
#141
Excellent
$87,930