Italian vs Immigrants from Taiwan Householder Income Ages 45 - 64 years
COMPARE
Italian
Immigrants from Taiwan
Householder Income Ages 45 - 64 years
Householder Income Ages 45 - 64 years Comparison
Italians
Immigrants from Taiwan
$110,224
HOUSEHOLDER INCOME AGES 45 - 64 YEARS
99.3/ 100
METRIC RATING
71st/ 347
METRIC RANK
$135,508
HOUSEHOLDER INCOME AGES 45 - 64 YEARS
100.0/ 100
METRIC RATING
1st/ 347
METRIC RANK
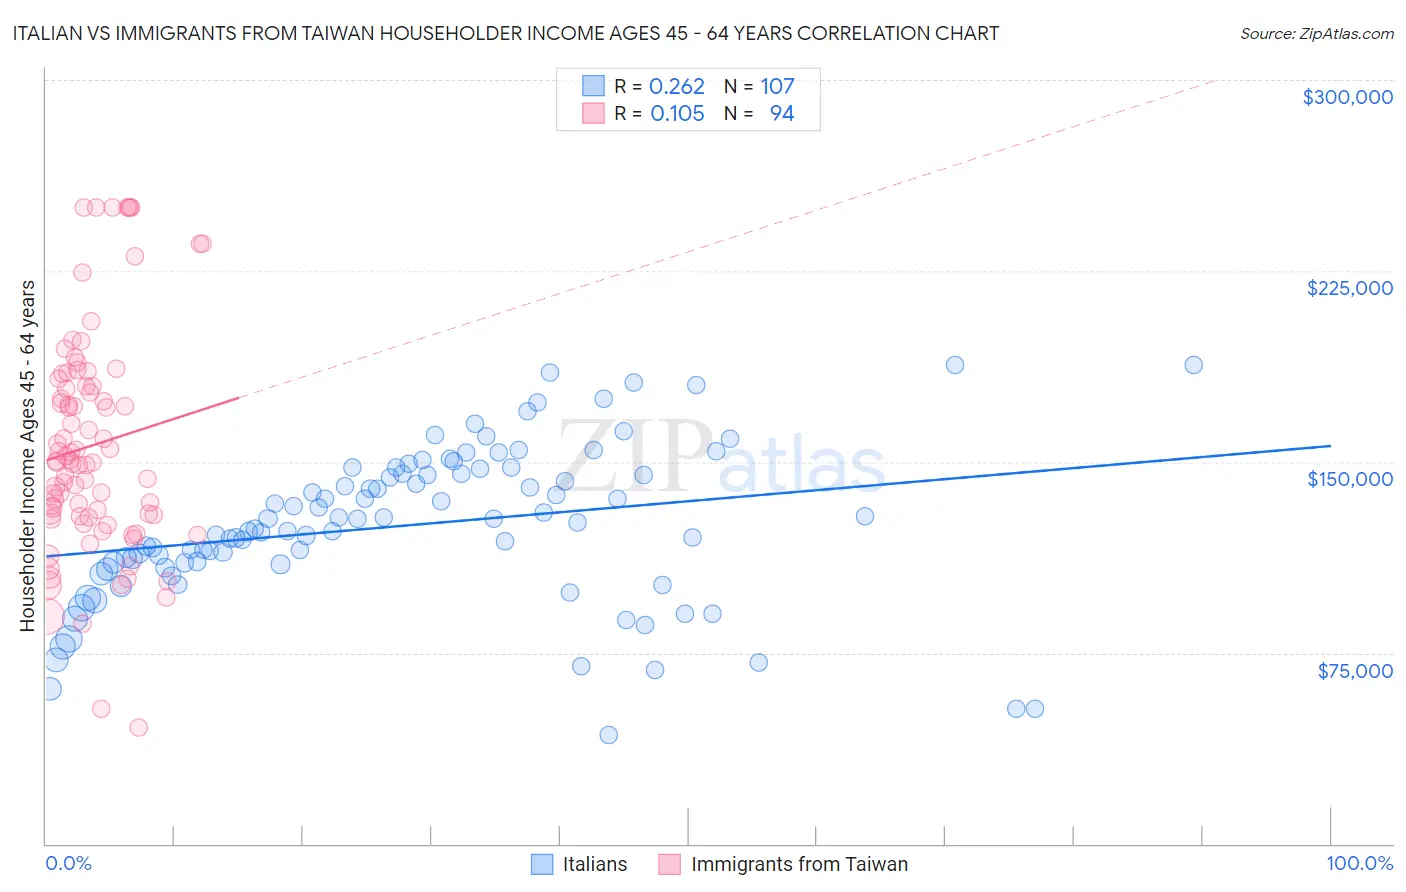
Italian vs Immigrants from Taiwan Householder Income Ages 45 - 64 years Correlation Chart
The statistical analysis conducted on geographies consisting of 571,010,703 people shows a weak positive correlation between the proportion of Italians and household income with householder between the ages 45 and 64 in the United States with a correlation coefficient (R) of 0.262 and weighted average of $110,224. Similarly, the statistical analysis conducted on geographies consisting of 297,970,743 people shows a poor positive correlation between the proportion of Immigrants from Taiwan and household income with householder between the ages 45 and 64 in the United States with a correlation coefficient (R) of 0.105 and weighted average of $135,508, a difference of 22.9%.
Householder Income Ages 45 - 64 years Correlation Summary
| Measurement | Italian | Immigrants from Taiwan |
| Minimum | $42,562 | $45,758 |
| Maximum | $188,030 | $250,001 |
| Range | $145,468 | $204,243 |
| Mean | $125,039 | $156,467 |
| Median | $126,199 | $150,003 |
| Interquartile 25% (IQ1) | $109,794 | $128,525 |
| Interquartile 75% (IQ3) | $145,518 | $179,879 |
| Interquartile Range (IQR) | $35,724 | $51,354 |
| Standard Deviation (Sample) | $30,277 | $43,921 |
| Standard Deviation (Population) | $30,135 | $43,687 |
Similar Demographics by Householder Income Ages 45 - 64 years
Demographics Similar to Italians by Householder Income Ages 45 - 64 years
In terms of householder income ages 45 - 64 years, the demographic groups most similar to Italians are Assyrian/Chaldean/Syriac ($110,201, a difference of 0.020%), Korean ($110,334, a difference of 0.10%), Argentinean ($110,103, a difference of 0.11%), Immigrants from Italy ($110,434, a difference of 0.19%), and Immigrants from Egypt ($109,941, a difference of 0.26%).
| Demographics | Rating | Rank | Householder Income Ages 45 - 64 years |
| Immigrants | Latvia | 99.6 /100 | #64 | Exceptional $111,454 |
| Immigrants | Belarus | 99.6 /100 | #65 | Exceptional $111,430 |
| New Zealanders | 99.6 /100 | #66 | Exceptional $111,286 |
| Laotians | 99.5 /100 | #67 | Exceptional $111,051 |
| Immigrants | Romania | 99.4 /100 | #68 | Exceptional $110,633 |
| Immigrants | Italy | 99.4 /100 | #69 | Exceptional $110,434 |
| Koreans | 99.3 /100 | #70 | Exceptional $110,334 |
| Italians | 99.3 /100 | #71 | Exceptional $110,224 |
| Assyrians/Chaldeans/Syriacs | 99.3 /100 | #72 | Exceptional $110,201 |
| Argentineans | 99.3 /100 | #73 | Exceptional $110,103 |
| Immigrants | Egypt | 99.2 /100 | #74 | Exceptional $109,941 |
| South Africans | 99.1 /100 | #75 | Exceptional $109,719 |
| Paraguayans | 99.0 /100 | #76 | Exceptional $109,447 |
| Immigrants | England | 99.0 /100 | #77 | Exceptional $109,446 |
| Immigrants | Canada | 99.0 /100 | #78 | Exceptional $109,402 |
Demographics Similar to Immigrants from Taiwan by Householder Income Ages 45 - 64 years
In terms of householder income ages 45 - 64 years, the demographic groups most similar to Immigrants from Taiwan are Filipino ($134,910, a difference of 0.44%), Immigrants from India ($132,488, a difference of 2.3%), Thai ($129,560, a difference of 4.6%), Immigrants from Singapore ($129,514, a difference of 4.6%), and Iranian ($129,350, a difference of 4.8%).
| Demographics | Rating | Rank | Householder Income Ages 45 - 64 years |
| Immigrants | Taiwan | 100.0 /100 | #1 | Exceptional $135,508 |
| Filipinos | 100.0 /100 | #2 | Exceptional $134,910 |
| Immigrants | India | 100.0 /100 | #3 | Exceptional $132,488 |
| Thais | 100.0 /100 | #4 | Exceptional $129,560 |
| Immigrants | Singapore | 100.0 /100 | #5 | Exceptional $129,514 |
| Iranians | 100.0 /100 | #6 | Exceptional $129,350 |
| Immigrants | Hong Kong | 100.0 /100 | #7 | Exceptional $127,500 |
| Immigrants | Iran | 100.0 /100 | #8 | Exceptional $126,940 |
| Okinawans | 100.0 /100 | #9 | Exceptional $124,796 |
| Immigrants | South Central Asia | 100.0 /100 | #10 | Exceptional $124,188 |
| Cypriots | 100.0 /100 | #11 | Exceptional $123,396 |
| Immigrants | Israel | 100.0 /100 | #12 | Exceptional $122,893 |
| Immigrants | Ireland | 100.0 /100 | #13 | Exceptional $122,757 |
| Indians (Asian) | 100.0 /100 | #14 | Exceptional $122,343 |
| Immigrants | Eastern Asia | 100.0 /100 | #15 | Exceptional $122,222 |