Iraqi vs Sierra Leonean Householder Income Ages 25 - 44 years

COMPARE

Iraqi
Race
Ancestry
AfghanAfricanAlaska NativeAlaskan AthabascanAlbanianAleutAlsatianAmericanApacheArabArapahoArgentineanArmenianAssyrian/Chaldean/SyriacAustralianAustrianBahamianBangladeshiBarbadianBasqueBelgianBelizeanBermudanBhutaneseBlackfeetBolivianBrazilianBritishBritish West IndianBulgarianBurmeseCajunCambodianCanadianCape VerdeanCarpatho RusynCelticCentral AmericanCentral American IndianCherokeeCheyenneChickasawChileanChineseChippewaChoctawColombianColvilleComancheCosta RicanCreeCreekCroatianCrowCubanCypriotCzechCzechoslovakianDanishDelawareDominicanDutchDutch West IndianEastern EuropeanEcuadorianEgyptianEnglishEstonianEthiopianEuropeanFijianFilipinoFinnishFrenchFrench American IndianFrench CanadianGermanGerman RussianGhanaianGreekGuamanian/ChamorroGuatemalanGuyaneseHaitianHmongHonduranHopiHoumaHungarianIcelanderIndian (Asian)IndonesianInupiatIranianIraqiIrishIroquoisIsraeliItalianJamaicanJapaneseJordanianKenyanKiowaKoreanLaotianLatvianLebaneseLiberianLithuanianLumbeeLuxembourgerMacedonianMalaysianMalteseMarshalleseMenomineeMexicanMexican American IndianMongolianMoroccanNative HawaiianNavajoNepaleseNew ZealanderNicaraguanNigerianNorthern EuropeanNorwegianOkinawanOsageOttawaPaiutePakistaniPalestinianPanamanianParaguayanPennsylvania GermanPeruvianPimaPolishPortuguesePotawatomiPuebloPuerto RicanPuget Sound SalishRomanianRussianSalvadoranSamoanScandinavianScotch-IrishScottishSeminoleSenegaleseSerbianShoshoneSiouxSlavicSlovakSloveneSomaliSouth AfricanSouth AmericanSouth American IndianSoviet UnionSpaniardSpanishSpanish AmericanSpanish American IndianSri LankanSubsaharan AfricanSudaneseSwedishSwissSyrianTaiwaneseThaiTlingit-HaidaTohono O'OdhamTonganTrinidadian and TobagonianTsimshianTurkishU.S. Virgin IslanderUgandanUkrainianUruguayanUteVenezuelanVietnameseWelshWest IndianYakamaYaquiYugoslavianYumanYup'ikZimbabwean
Immigration
NonimmigrantsImmigrantsAfghanistanAfricaAlbaniaArgentinaArmeniaAsiaAustraliaAustriaBahamasBangladeshBarbadosBelarusBelgiumBelizeBoliviaBosnia and HerzegovinaBrazilBulgariaBurma/MyanmarCabo VerdeCambodiaCameroonCanadaCaribbeanCentral AmericaChileChinaColombiaCongoCosta RicaCroatiaCubaCzechoslovakiaDenmarkDominicaDominican RepublicEastern AfricaEastern AsiaEastern EuropeEcuadorEgyptEl SalvadorEnglandEritreaEthiopiaEuropeFijiFranceGermanyGhanaGreeceGrenadaGuatemalaGuyanaHaitiHondurasHong KongHungaryIndiaIndonesiaIranIraqIrelandIsraelItalyJamaicaJapanJordanKazakhstanKenyaKoreaKuwaitLaosLatin AmericaLatviaLebanonLiberiaLithuaniaMalaysiaMexicoMicronesiaMiddle AfricaMoldovaMoroccoNepalNetherlandsNicaraguaNigeriaNorth AmericaNorth MacedoniaNorthern AfricaNorthern EuropeNorwayOceaniaPakistanPanamaPeruPhilippinesPolandPortugalRomaniaRussiaSaudi ArabiaScotlandSenegalSerbiaSierra LeoneSingaporeSomaliaSouth AfricaSouth AmericaSouth Central AsiaSouth Eastern AsiaSouthern EuropeSpainSri LankaSt. Vincent and the GrenadinesSudanSwedenSwitzerlandSyriaTaiwanThailandTrinidad and TobagoTurkeyUgandaUkraineUruguayUzbekistanVenezuelaVietnamWest IndiesWestern AfricaWestern AsiaWestern EuropeYemenZaireZimbabweAzores
Sierra Leonean
Race
Ancestry
AfghanAfricanAlaska NativeAlaskan AthabascanAlbanianAleutAlsatianAmericanApacheArabArapahoArgentineanArmenianAssyrian/Chaldean/SyriacAustralianAustrianBahamianBangladeshiBarbadianBasqueBelgianBelizeanBermudanBhutaneseBlackfeetBolivianBrazilianBritishBritish West IndianBulgarianBurmeseCajunCambodianCanadianCape VerdeanCarpatho RusynCelticCentral AmericanCentral American IndianCherokeeCheyenneChickasawChileanChineseChippewaChoctawColombianColvilleComancheCosta RicanCreeCreekCroatianCrowCubanCypriotCzechCzechoslovakianDanishDelawareDominicanDutchDutch West IndianEastern EuropeanEcuadorianEgyptianEnglishEstonianEthiopianEuropeanFijianFilipinoFinnishFrenchFrench American IndianFrench CanadianGermanGerman RussianGhanaianGreekGuamanian/ChamorroGuatemalanGuyaneseHaitianHmongHonduranHopiHoumaHungarianIcelanderIndian (Asian)IndonesianInupiatIranianIrishIroquoisIsraeliItalianJamaicanJapaneseJordanianKenyanKiowaKoreanLaotianLatvianLebaneseLiberianLithuanianLumbeeLuxembourgerMacedonianMalaysianMalteseMarshalleseMenomineeMexicanMexican American IndianMongolianMoroccanNative HawaiianNavajoNepaleseNew ZealanderNicaraguanNigerianNorthern EuropeanNorwegianOkinawanOsageOttawaPaiutePakistaniPalestinianPanamanianParaguayanPennsylvania GermanPeruvianPimaPolishPortuguesePotawatomiPuebloPuerto RicanPuget Sound SalishRomanianRussianSalvadoranSamoanScandinavianScotch-IrishScottishSeminoleSenegaleseSerbianShoshoneSierra LeoneanSiouxSlavicSlovakSloveneSomaliSouth AfricanSouth AmericanSouth American IndianSoviet UnionSpaniardSpanishSpanish AmericanSpanish American IndianSri LankanSubsaharan AfricanSudaneseSwedishSwissSyrianTaiwaneseThaiTlingit-HaidaTohono O'OdhamTonganTrinidadian and TobagonianTsimshianTurkishU.S. Virgin IslanderUgandanUkrainianUruguayanUteVenezuelanVietnameseWelshWest IndianYakamaYaquiYugoslavianYumanYup'ikZimbabwean
Immigration
NonimmigrantsImmigrantsAfghanistanAfricaAlbaniaArgentinaArmeniaAsiaAustraliaAustriaBahamasBangladeshBarbadosBelarusBelgiumBelizeBoliviaBosnia and HerzegovinaBrazilBulgariaBurma/MyanmarCabo VerdeCambodiaCameroonCanadaCaribbeanCentral AmericaChileChinaColombiaCongoCosta RicaCroatiaCubaCzechoslovakiaDenmarkDominicaDominican RepublicEastern AfricaEastern AsiaEastern EuropeEcuadorEgyptEl SalvadorEnglandEritreaEthiopiaEuropeFijiFranceGermanyGhanaGreeceGrenadaGuatemalaGuyanaHaitiHondurasHong KongHungaryIndiaIndonesiaIranIraqIrelandIsraelItalyJamaicaJapanJordanKazakhstanKenyaKoreaKuwaitLaosLatin AmericaLatviaLebanonLiberiaLithuaniaMalaysiaMexicoMicronesiaMiddle AfricaMoldovaMoroccoNepalNetherlandsNicaraguaNigeriaNorth AmericaNorth MacedoniaNorthern AfricaNorthern EuropeNorwayOceaniaPakistanPanamaPeruPhilippinesPolandPortugalRomaniaRussiaSaudi ArabiaScotlandSenegalSerbiaSierra LeoneSingaporeSomaliaSouth AfricaSouth AmericaSouth Central AsiaSouth Eastern AsiaSouthern EuropeSpainSri LankaSt. Vincent and the GrenadinesSudanSwedenSwitzerlandSyriaTaiwanThailandTrinidad and TobagoTurkeyUgandaUkraineUruguayUzbekistanVenezuelaVietnamWest IndiesWestern AfricaWestern AsiaWestern EuropeYemenZaireZimbabweAzores
Householder Income Ages 25 - 44 years
Income
Poverty
Unemployment
Labor Participation
Family Structure
Vehicle Availability
Education Level
Disability

Householder Income Ages 25 - 44 years Comparison

Iraqis

Sierra Leoneans

Poor
Fair
$90,764
HOUSEHOLDER INCOME AGES 25 - 44 YEARS
10.8/ 100
METRIC RATING
211th/ 347
METRIC RANK
$93,435
HOUSEHOLDER INCOME AGES 25 - 44 YEARS
34.8/ 100
METRIC RATING
186th/ 347
METRIC RANK

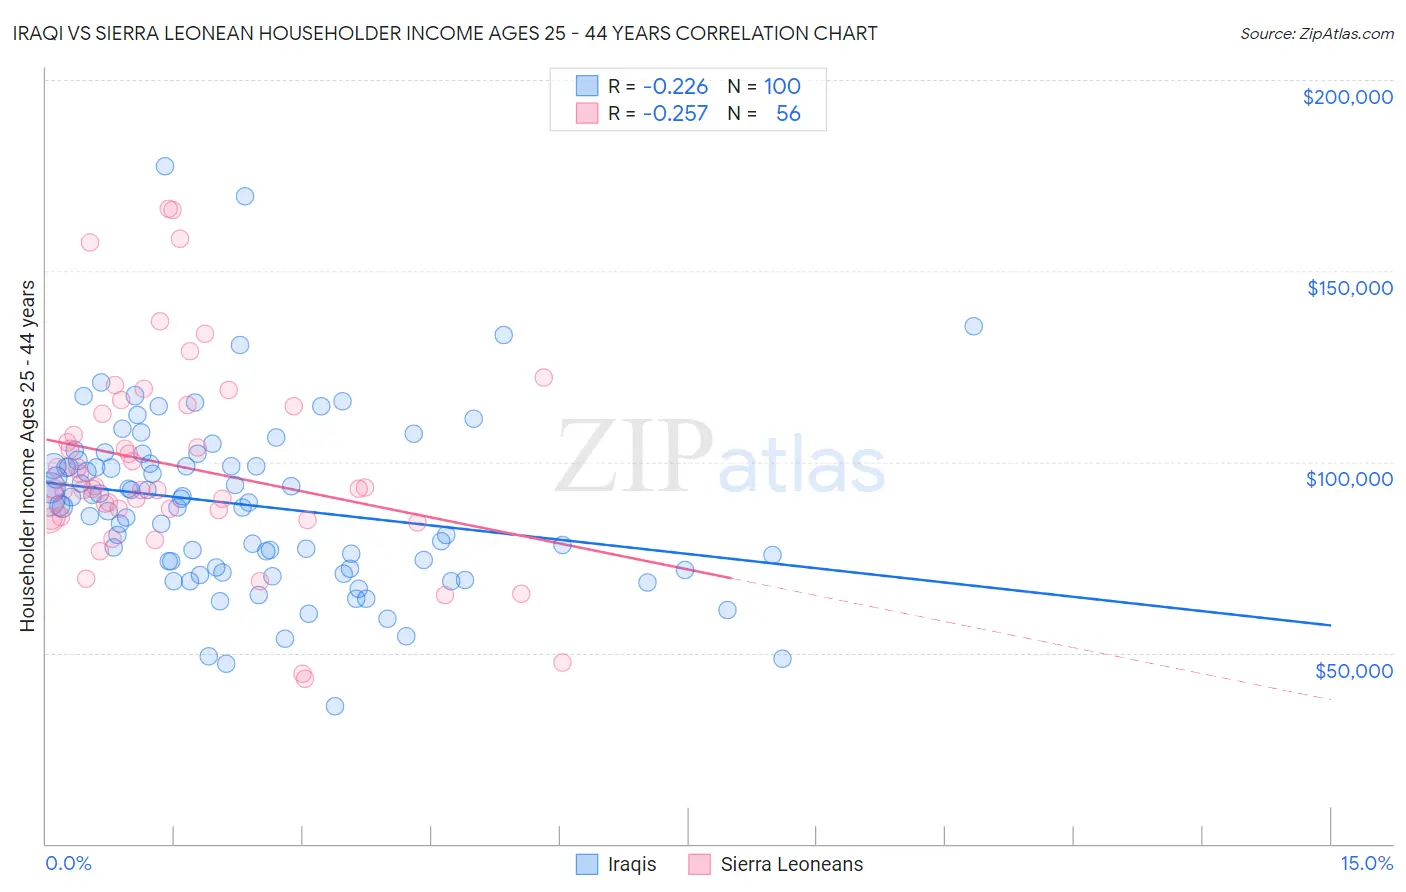
Iraqi vs Sierra Leonean Householder Income Ages 25 - 44 years Correlation Chart

The statistical analysis conducted on geographies consisting of 170,561,402 people shows a weak negative correlation between the proportion of Iraqis and household income with householder between the ages 25 and 44 in the United States with a correlation coefficient (R) of -0.226 and weighted average of $90,764. Similarly, the statistical analysis conducted on geographies consisting of 83,314,226 people shows a weak negative correlation between the proportion of Sierra Leoneans and household income with householder between the ages 25 and 44 in the United States with a correlation coefficient (R) of -0.257 and weighted average of $93,435, a difference of 2.9%.
Iraqi vs Sierra Leonean Householder Income Ages 25 - 44 years

Householder Income Ages 25 - 44 years Correlation Summary

MeasurementIraqiSierra Leonean
Minimum$35,938$43,346
Maximum$177,567$166,389
Range$141,629$123,043
Mean$88,687$98,723
Median$88,906$93,030
Interquartile 25% (IQ1)$72,138$85,860
Interquartile 75% (IQ3)$99,186$113,651
Interquartile Range (IQR)$27,048$27,791
Standard Deviation (Sample)$23,025$26,448
Standard Deviation (Population)$22,910$26,211

Similar Demographics by Householder Income Ages 25 - 44 years

Demographics Similar to Iraqis by Householder Income Ages 25 - 44 years

In terms of householder income ages 25 - 44 years, the demographic groups most similar to Iraqis are Immigrants from Kenya ($90,767, a difference of 0.0%), Hawaiian ($90,722, a difference of 0.050%), Immigrants from Bangladesh ($90,448, a difference of 0.35%), Immigrants from Africa ($90,372, a difference of 0.43%), and Immigrants from Uruguay ($91,171, a difference of 0.45%).
DemographicsRating | RankHouseholder Income Ages 25 - 44 years
Nepalese
15.4
/100
|
#204
Poor
$91,498
Immigrants | Eastern Africa
15.2
/100
|
#205
Poor
$91,458
Aleuts
14.5
/100
|
#206
Poor
$91,370
Yugoslavians
14.5
/100
|
#207
Poor
$91,368
Immigrants | Thailand
14.3
/100
|
#208
Poor
$91,337
Immigrants | Uruguay
13.2
/100
|
#209
Poor
$91,171
Immigrants | Kenya
10.9
/100
|
#210
Poor
$90,767
Iraqis
10.8
/100
|
#211
Poor
$90,764
Hawaiians
10.6
/100
|
#212
Poor
$90,722
Immigrants | Bangladesh
9.3
/100
|
#213
Tragic
$90,448
Immigrants | Africa
8.9
/100
|
#214
Tragic
$90,372
Panamanians
8.1
/100
|
#215
Tragic
$90,193
Ghanaians
7.9
/100
|
#216
Tragic
$90,137
Scotch-Irish
7.3
/100
|
#217
Tragic
$89,969
Guyanese
7.1
/100
|
#218
Tragic
$89,940

Demographics Similar to Sierra Leoneans by Householder Income Ages 25 - 44 years

In terms of householder income ages 25 - 44 years, the demographic groups most similar to Sierra Leoneans are Immigrants from Eritrea ($93,466, a difference of 0.030%), Spaniard ($93,366, a difference of 0.070%), German ($93,531, a difference of 0.10%), Guamanian/Chamorro ($93,569, a difference of 0.14%), and Uruguayan ($93,631, a difference of 0.21%).
DemographicsRating | RankHouseholder Income Ages 25 - 44 years
French Canadians
38.2
/100
|
#179
Fair
$93,694
French
37.8
/100
|
#180
Fair
$93,665
Puget Sound Salish
37.7
/100
|
#181
Fair
$93,661
Uruguayans
37.3
/100
|
#182
Fair
$93,631
Guamanians/Chamorros
36.5
/100
|
#183
Fair
$93,569
Germans
36.0
/100
|
#184
Fair
$93,531
Immigrants | Eritrea
35.2
/100
|
#185
Fair
$93,466
Sierra Leoneans
34.8
/100
|
#186
Fair
$93,435
Spaniards
34.0
/100
|
#187
Fair
$93,366
Immigrants | Sierra Leone
30.9
/100
|
#188
Fair
$93,115
Dutch
30.5
/100
|
#189
Fair
$93,081
Welsh
30.0
/100
|
#190
Fair
$93,039
Tlingit-Haida
29.4
/100
|
#191
Fair
$92,987
Immigrants | Costa Rica
28.2
/100
|
#192
Fair
$92,876
Samoans
23.0
/100
|
#193
Fair
$92,385