Iraqi vs Lebanese Householder Income Ages 45 - 64 years
COMPARE
Iraqi
Lebanese
Householder Income Ages 45 - 64 years
Householder Income Ages 45 - 64 years Comparison
Iraqis
Lebanese
$99,387
HOUSEHOLDER INCOME AGES 45 - 64 YEARS
38.5/ 100
METRIC RATING
187th/ 347
METRIC RANK
$104,734
HOUSEHOLDER INCOME AGES 45 - 64 YEARS
90.1/ 100
METRIC RATING
132nd/ 347
METRIC RANK
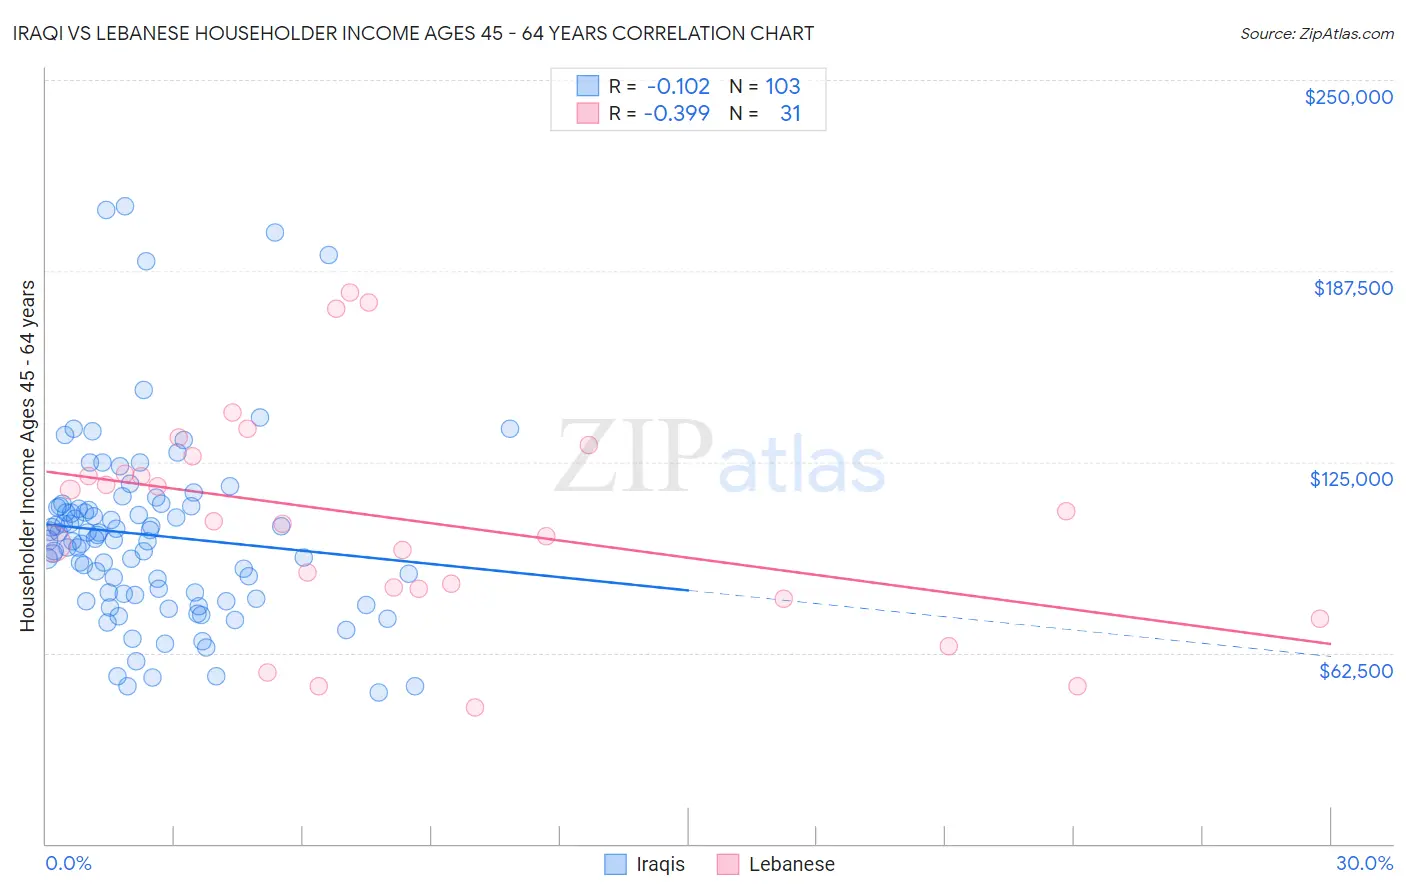
Iraqi vs Lebanese Householder Income Ages 45 - 64 years Correlation Chart
The statistical analysis conducted on geographies consisting of 170,546,926 people shows a poor negative correlation between the proportion of Iraqis and household income with householder between the ages 45 and 64 in the United States with a correlation coefficient (R) of -0.102 and weighted average of $99,387. Similarly, the statistical analysis conducted on geographies consisting of 400,891,576 people shows a mild negative correlation between the proportion of Lebanese and household income with householder between the ages 45 and 64 in the United States with a correlation coefficient (R) of -0.399 and weighted average of $104,734, a difference of 5.4%.
Householder Income Ages 45 - 64 years Correlation Summary
| Measurement | Iraqi | Lebanese |
| Minimum | $49,554 | $44,583 |
| Maximum | $208,614 | $180,429 |
| Range | $159,060 | $135,846 |
| Mean | $101,029 | $106,151 |
| Median | $99,398 | $105,539 |
| Interquartile 25% (IQ1) | $81,325 | $83,438 |
| Interquartile 75% (IQ3) | $110,313 | $126,958 |
| Interquartile Range (IQR) | $28,988 | $43,520 |
| Standard Deviation (Sample) | $30,760 | $35,508 |
| Standard Deviation (Population) | $30,611 | $34,931 |
Similar Demographics by Householder Income Ages 45 - 64 years
Demographics Similar to Iraqis by Householder Income Ages 45 - 64 years
In terms of householder income ages 45 - 64 years, the demographic groups most similar to Iraqis are Immigrants from Portugal ($99,203, a difference of 0.19%), Immigrants from South America ($99,126, a difference of 0.26%), Dutch ($99,650, a difference of 0.27%), French Canadian ($99,093, a difference of 0.30%), and Colombian ($99,772, a difference of 0.39%).
| Demographics | Rating | Rank | Householder Income Ages 45 - 64 years |
| Aleuts | 46.6 /100 | #180 | Average $100,052 |
| Immigrants | Immigrants | 45.3 /100 | #181 | Average $99,943 |
| Finns | 44.8 /100 | #182 | Average $99,904 |
| Spaniards | 44.6 /100 | #183 | Average $99,889 |
| French | 43.8 /100 | #184 | Average $99,824 |
| Colombians | 43.2 /100 | #185 | Average $99,772 |
| Dutch | 41.7 /100 | #186 | Average $99,650 |
| Iraqis | 38.5 /100 | #187 | Fair $99,387 |
| Immigrants | Portugal | 36.3 /100 | #188 | Fair $99,203 |
| Immigrants | South America | 35.4 /100 | #189 | Fair $99,126 |
| French Canadians | 35.1 /100 | #190 | Fair $99,093 |
| Kenyans | 33.7 /100 | #191 | Fair $98,970 |
| Celtics | 32.9 /100 | #192 | Fair $98,896 |
| Hawaiians | 31.6 /100 | #193 | Fair $98,778 |
| Uruguayans | 30.3 /100 | #194 | Fair $98,660 |
Demographics Similar to Lebanese by Householder Income Ages 45 - 64 years
In terms of householder income ages 45 - 64 years, the demographic groups most similar to Lebanese are Immigrants from Syria ($104,858, a difference of 0.12%), Arab ($104,566, a difference of 0.16%), Canadian ($104,560, a difference of 0.17%), Immigrants from Zimbabwe ($104,992, a difference of 0.25%), and Brazilian ($104,408, a difference of 0.31%).
| Demographics | Rating | Rank | Householder Income Ages 45 - 64 years |
| Pakistanis | 92.4 /100 | #125 | Exceptional $105,317 |
| Portuguese | 92.4 /100 | #126 | Exceptional $105,309 |
| Immigrants | Saudi Arabia | 92.2 /100 | #127 | Exceptional $105,249 |
| Native Hawaiians | 91.8 /100 | #128 | Exceptional $105,149 |
| Peruvians | 91.5 /100 | #129 | Exceptional $105,070 |
| Immigrants | Zimbabwe | 91.2 /100 | #130 | Exceptional $104,992 |
| Immigrants | Syria | 90.7 /100 | #131 | Exceptional $104,858 |
| Lebanese | 90.1 /100 | #132 | Exceptional $104,734 |
| Arabs | 89.3 /100 | #133 | Excellent $104,566 |
| Canadians | 89.3 /100 | #134 | Excellent $104,560 |
| Brazilians | 88.6 /100 | #135 | Excellent $104,408 |
| Taiwanese | 87.4 /100 | #136 | Excellent $104,180 |
| Hungarians | 85.8 /100 | #137 | Excellent $103,913 |
| Ethiopians | 84.7 /100 | #138 | Excellent $103,736 |
| Immigrants | Oceania | 84.5 /100 | #139 | Excellent $103,705 |