Indonesian vs Immigrants from Kazakhstan Median Male Earnings
COMPARE
Indonesian
Immigrants from Kazakhstan
Median Male Earnings
Median Male Earnings Comparison
Indonesians
Immigrants from Kazakhstan
$47,503
MEDIAN MALE EARNINGS
0.1/ 100
METRIC RATING
293rd/ 347
METRIC RANK
$59,278
MEDIAN MALE EARNINGS
99.1/ 100
METRIC RATING
92nd/ 347
METRIC RANK
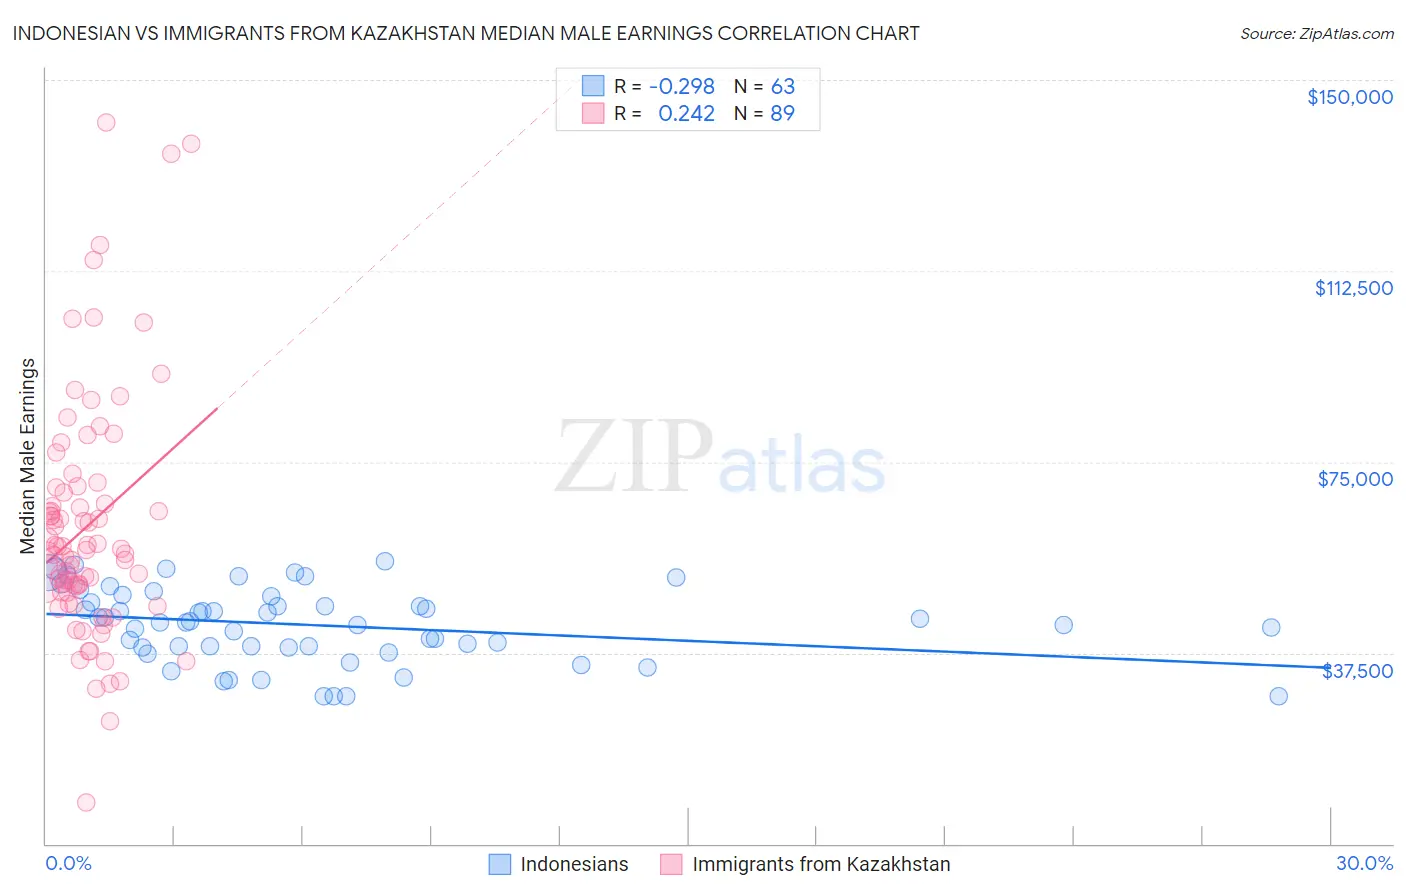
Indonesian vs Immigrants from Kazakhstan Median Male Earnings Correlation Chart
The statistical analysis conducted on geographies consisting of 162,701,910 people shows a weak negative correlation between the proportion of Indonesians and median male earnings in the United States with a correlation coefficient (R) of -0.298 and weighted average of $47,503. Similarly, the statistical analysis conducted on geographies consisting of 124,430,044 people shows a weak positive correlation between the proportion of Immigrants from Kazakhstan and median male earnings in the United States with a correlation coefficient (R) of 0.242 and weighted average of $59,278, a difference of 24.8%.
Median Male Earnings Correlation Summary
| Measurement | Indonesian | Immigrants from Kazakhstan |
| Minimum | $28,857 | $8,214 |
| Maximum | $55,385 | $141,534 |
| Range | $26,528 | $133,320 |
| Mean | $42,970 | $62,279 |
| Median | $43,436 | $57,775 |
| Interquartile 25% (IQ1) | $38,534 | $49,614 |
| Interquartile 75% (IQ3) | $48,720 | $69,378 |
| Interquartile Range (IQR) | $10,186 | $19,764 |
| Standard Deviation (Sample) | $7,238 | $23,727 |
| Standard Deviation (Population) | $7,181 | $23,593 |
Similar Demographics by Median Male Earnings
Demographics Similar to Indonesians by Median Male Earnings
In terms of median male earnings, the demographic groups most similar to Indonesians are Immigrants from Nicaragua ($47,482, a difference of 0.040%), Central American Indian ($47,433, a difference of 0.15%), Immigrants from Dominica ($47,651, a difference of 0.31%), Inupiat ($47,281, a difference of 0.47%), and Choctaw ($47,729, a difference of 0.48%).
| Demographics | Rating | Rank | Median Male Earnings |
| Mexican American Indians | 0.2 /100 | #286 | Tragic $47,990 |
| Immigrants | El Salvador | 0.2 /100 | #287 | Tragic $47,973 |
| Shoshone | 0.2 /100 | #288 | Tragic $47,930 |
| Chickasaw | 0.1 /100 | #289 | Tragic $47,832 |
| Immigrants | Belize | 0.1 /100 | #290 | Tragic $47,809 |
| Choctaw | 0.1 /100 | #291 | Tragic $47,729 |
| Immigrants | Dominica | 0.1 /100 | #292 | Tragic $47,651 |
| Indonesians | 0.1 /100 | #293 | Tragic $47,503 |
| Immigrants | Nicaragua | 0.1 /100 | #294 | Tragic $47,482 |
| Central American Indians | 0.1 /100 | #295 | Tragic $47,433 |
| Inupiat | 0.1 /100 | #296 | Tragic $47,281 |
| Dominicans | 0.1 /100 | #297 | Tragic $47,204 |
| Immigrants | Micronesia | 0.1 /100 | #298 | Tragic $47,177 |
| Immigrants | Zaire | 0.1 /100 | #299 | Tragic $47,070 |
| U.S. Virgin Islanders | 0.1 /100 | #300 | Tragic $47,066 |
Demographics Similar to Immigrants from Kazakhstan by Median Male Earnings
In terms of median male earnings, the demographic groups most similar to Immigrants from Kazakhstan are Immigrants from Southern Europe ($59,217, a difference of 0.10%), Laotian ($59,351, a difference of 0.12%), Austrian ($59,359, a difference of 0.14%), Immigrants from North Macedonia ($59,189, a difference of 0.15%), and Immigrants from Moldova ($59,417, a difference of 0.24%).
| Demographics | Rating | Rank | Median Male Earnings |
| Italians | 99.3 /100 | #85 | Exceptional $59,551 |
| Immigrants | England | 99.3 /100 | #86 | Exceptional $59,527 |
| Macedonians | 99.3 /100 | #87 | Exceptional $59,522 |
| Immigrants | Argentina | 99.3 /100 | #88 | Exceptional $59,491 |
| Immigrants | Moldova | 99.2 /100 | #89 | Exceptional $59,417 |
| Austrians | 99.2 /100 | #90 | Exceptional $59,359 |
| Laotians | 99.2 /100 | #91 | Exceptional $59,351 |
| Immigrants | Kazakhstan | 99.1 /100 | #92 | Exceptional $59,278 |
| Immigrants | Southern Europe | 99.0 /100 | #93 | Exceptional $59,217 |
| Immigrants | North Macedonia | 99.0 /100 | #94 | Exceptional $59,189 |
| Immigrants | Lebanon | 98.6 /100 | #95 | Exceptional $58,835 |
| Albanians | 98.4 /100 | #96 | Exceptional $58,680 |
| Northern Europeans | 98.2 /100 | #97 | Exceptional $58,588 |
| Jordanians | 98.1 /100 | #98 | Exceptional $58,500 |
| Immigrants | Poland | 98.0 /100 | #99 | Exceptional $58,452 |