Indonesian vs Comanche Householder Income Over 65 years
COMPARE
Indonesian
Comanche
Householder Income Over 65 years
Householder Income Over 65 years Comparison
Indonesians
Comanche
$54,176
HOUSEHOLDER INCOME OVER 65 YEARS
0.1/ 100
METRIC RATING
273rd/ 347
METRIC RANK
$54,922
HOUSEHOLDER INCOME OVER 65 YEARS
0.2/ 100
METRIC RATING
261st/ 347
METRIC RANK
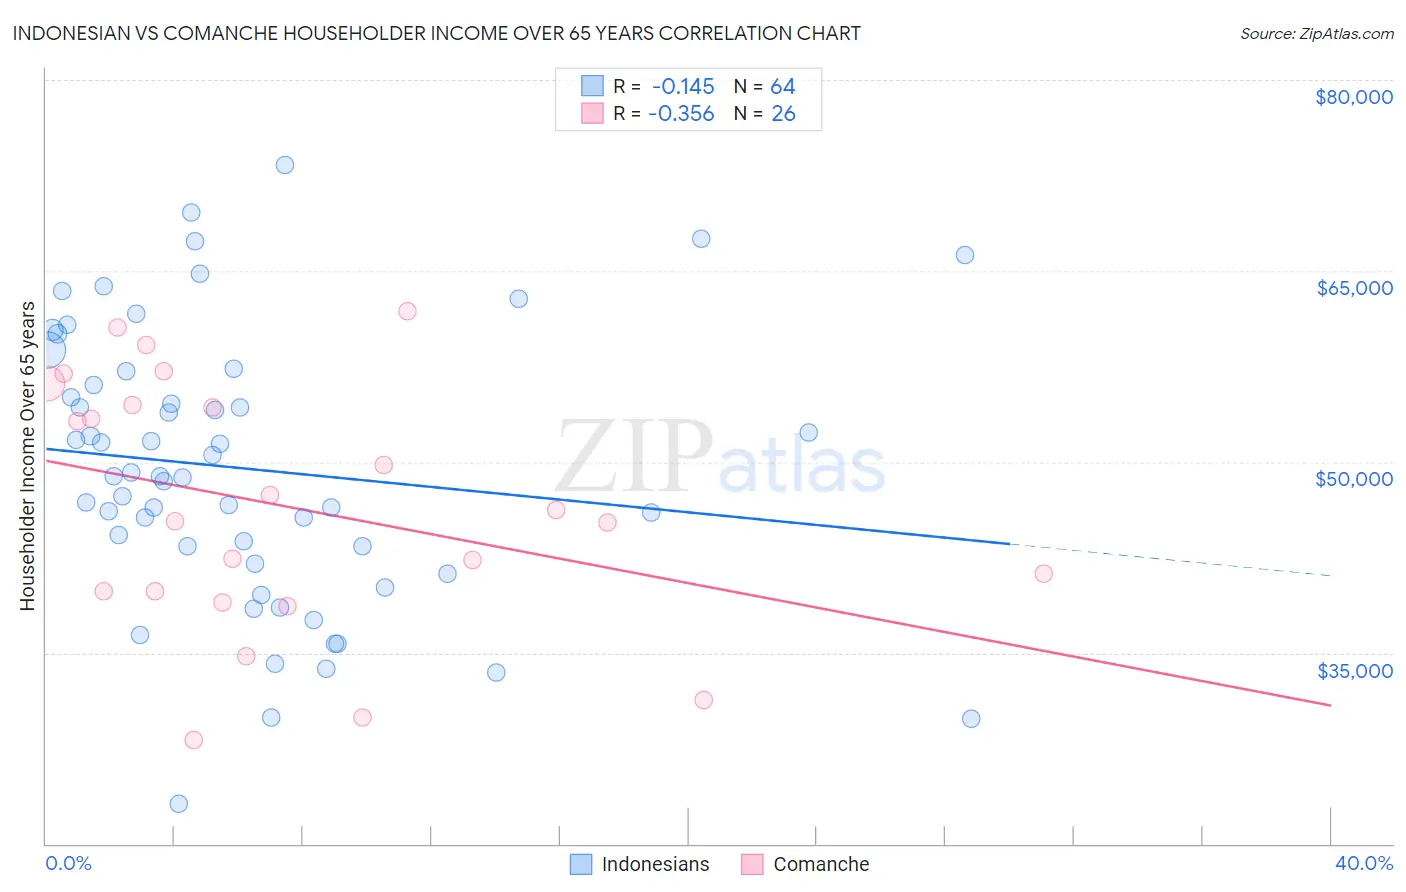
Indonesian vs Comanche Householder Income Over 65 years Correlation Chart
The statistical analysis conducted on geographies consisting of 162,395,174 people shows a poor negative correlation between the proportion of Indonesians and household income with householder over the age of 65 in the United States with a correlation coefficient (R) of -0.145 and weighted average of $54,176. Similarly, the statistical analysis conducted on geographies consisting of 109,617,596 people shows a mild negative correlation between the proportion of Comanche and household income with householder over the age of 65 in the United States with a correlation coefficient (R) of -0.356 and weighted average of $54,922, a difference of 1.4%.
Householder Income Over 65 years Correlation Summary
| Measurement | Indonesian | Comanche |
| Minimum | $23,126 | $28,127 |
| Maximum | $73,361 | $61,875 |
| Range | $50,235 | $33,748 |
| Mean | $49,441 | $46,472 |
| Median | $48,888 | $45,782 |
| Interquartile 25% (IQ1) | $42,656 | $39,810 |
| Interquartile 75% (IQ3) | $56,577 | $54,432 |
| Interquartile Range (IQR) | $13,920 | $14,621 |
| Standard Deviation (Sample) | $10,775 | $9,777 |
| Standard Deviation (Population) | $10,690 | $9,587 |
Demographics Similar to Indonesians and Comanche by Householder Income Over 65 years
In terms of householder income over 65 years, the demographic groups most similar to Indonesians are Barbadian ($54,163, a difference of 0.020%), Potawatomi ($54,212, a difference of 0.070%), Cherokee ($54,133, a difference of 0.080%), Cree ($54,129, a difference of 0.090%), and Cheyenne ($54,096, a difference of 0.15%). Similarly, the demographic groups most similar to Comanche are Immigrants from West Indies ($54,927, a difference of 0.010%), West Indian ($54,936, a difference of 0.030%), Ecuadorian ($54,958, a difference of 0.070%), Bangladeshi ($54,719, a difference of 0.37%), and French American Indian ($54,699, a difference of 0.41%).
| Demographics | Rating | Rank | Householder Income Over 65 years |
| Trinidadians and Tobagonians | 0.3 /100 | #257 | Tragic $55,327 |
| Ecuadorians | 0.2 /100 | #258 | Tragic $54,958 |
| West Indians | 0.2 /100 | #259 | Tragic $54,936 |
| Immigrants | West Indies | 0.2 /100 | #260 | Tragic $54,927 |
| Comanche | 0.2 /100 | #261 | Tragic $54,922 |
| Bangladeshis | 0.1 /100 | #262 | Tragic $54,719 |
| French American Indians | 0.1 /100 | #263 | Tragic $54,699 |
| Apache | 0.1 /100 | #264 | Tragic $54,668 |
| Belizeans | 0.1 /100 | #265 | Tragic $54,580 |
| Jamaicans | 0.1 /100 | #266 | Tragic $54,560 |
| Guatemalans | 0.1 /100 | #267 | Tragic $54,526 |
| Immigrants | Zaire | 0.1 /100 | #268 | Tragic $54,512 |
| Nicaraguans | 0.1 /100 | #269 | Tragic $54,474 |
| Immigrants | Senegal | 0.1 /100 | #270 | Tragic $54,447 |
| Liberians | 0.1 /100 | #271 | Tragic $54,356 |
| Potawatomi | 0.1 /100 | #272 | Tragic $54,212 |
| Indonesians | 0.1 /100 | #273 | Tragic $54,176 |
| Barbadians | 0.1 /100 | #274 | Tragic $54,163 |
| Cherokee | 0.1 /100 | #275 | Tragic $54,133 |
| Cree | 0.1 /100 | #276 | Tragic $54,129 |
| Cheyenne | 0.1 /100 | #277 | Tragic $54,096 |