Immigrants vs Immigrants from Vietnam Median Household Income
COMPARE
Immigrants
Immigrants from Vietnam
Median Household Income
Median Household Income Comparison
Immigrants
Immigrants from Vietnam
$85,818
MEDIAN HOUSEHOLD INCOME
61.3/ 100
METRIC RATING
167th/ 347
METRIC RANK
$91,987
MEDIAN HOUSEHOLD INCOME
98.8/ 100
METRIC RATING
91st/ 347
METRIC RANK
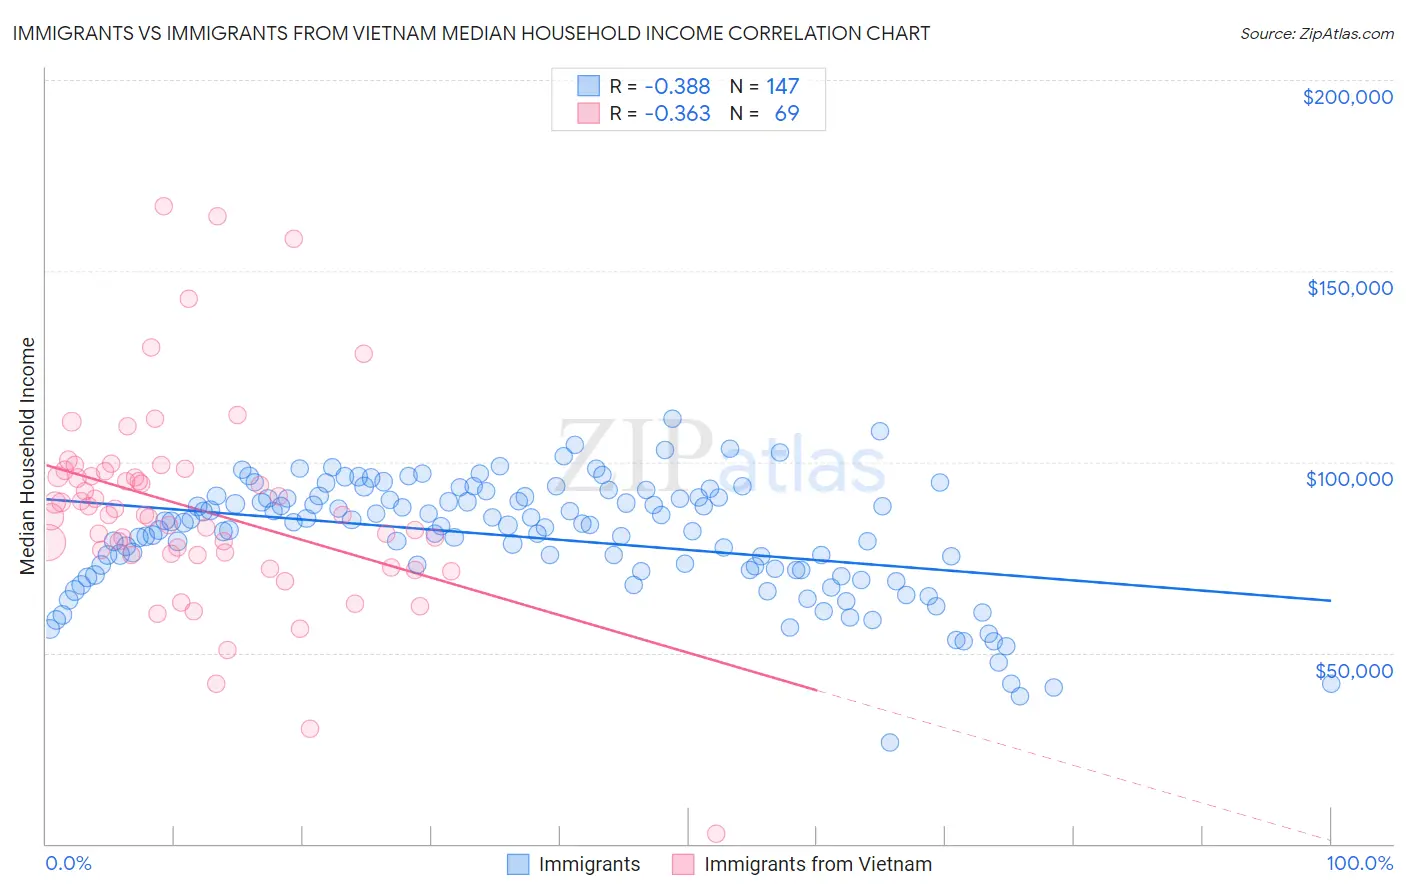
Immigrants vs Immigrants from Vietnam Median Household Income Correlation Chart
The statistical analysis conducted on geographies consisting of 575,988,831 people shows a mild negative correlation between the proportion of Immigrants and median household income in the United States with a correlation coefficient (R) of -0.388 and weighted average of $85,818. Similarly, the statistical analysis conducted on geographies consisting of 404,446,933 people shows a mild negative correlation between the proportion of Immigrants from Vietnam and median household income in the United States with a correlation coefficient (R) of -0.363 and weighted average of $91,987, a difference of 7.2%.
Median Household Income Correlation Summary
| Measurement | Immigrants | Immigrants from Vietnam |
| Minimum | $26,558 | $2,499 |
| Maximum | $111,218 | $166,850 |
| Range | $84,660 | $164,351 |
| Mean | $80,268 | $87,664 |
| Median | $83,546 | $86,139 |
| Interquartile 25% (IQ1) | $71,664 | $75,826 |
| Interquartile 75% (IQ3) | $90,776 | $96,947 |
| Interquartile Range (IQR) | $19,112 | $21,121 |
| Standard Deviation (Sample) | $15,311 | $26,629 |
| Standard Deviation (Population) | $15,259 | $26,435 |
Similar Demographics by Median Household Income
Demographics Similar to Immigrants by Median Household Income
In terms of median household income, the demographic groups most similar to Immigrants are Icelander ($85,797, a difference of 0.020%), Colombian ($85,716, a difference of 0.12%), Swiss ($85,681, a difference of 0.16%), Immigrants from South America ($85,611, a difference of 0.24%), and Scandinavian ($86,073, a difference of 0.30%).
| Demographics | Rating | Rank | Median Household Income |
| Luxembourgers | 70.0 /100 | #160 | Good $86,418 |
| Slavs | 69.7 /100 | #161 | Good $86,398 |
| Guamanians/Chamorros | 67.7 /100 | #162 | Good $86,255 |
| Czechs | 66.4 /100 | #163 | Good $86,164 |
| Irish | 66.2 /100 | #164 | Good $86,145 |
| Norwegians | 65.3 /100 | #165 | Good $86,084 |
| Scandinavians | 65.1 /100 | #166 | Good $86,073 |
| Immigrants | Immigrants | 61.3 /100 | #167 | Good $85,818 |
| Icelanders | 61.0 /100 | #168 | Good $85,797 |
| Colombians | 59.7 /100 | #169 | Average $85,716 |
| Swiss | 59.2 /100 | #170 | Average $85,681 |
| Immigrants | South America | 58.1 /100 | #171 | Average $85,611 |
| Slovenes | 57.4 /100 | #172 | Average $85,562 |
| Immigrants | Cameroon | 53.4 /100 | #173 | Average $85,314 |
| Scottish | 50.0 /100 | #174 | Average $85,101 |
Demographics Similar to Immigrants from Vietnam by Median Household Income
In terms of median household income, the demographic groups most similar to Immigrants from Vietnam are Assyrian/Chaldean/Syriac ($91,991, a difference of 0.0%), Romanian ($91,994, a difference of 0.010%), Immigrants from Canada ($92,029, a difference of 0.050%), Immigrants from Western Europe ($91,936, a difference of 0.060%), and Immigrants from Lebanon ($91,887, a difference of 0.11%).
| Demographics | Rating | Rank | Median Household Income |
| Immigrants | Argentina | 99.1 /100 | #84 | Exceptional $92,417 |
| Immigrants | Croatia | 99.0 /100 | #85 | Exceptional $92,225 |
| Immigrants | England | 98.9 /100 | #86 | Exceptional $92,098 |
| Immigrants | Hungary | 98.9 /100 | #87 | Exceptional $92,094 |
| Immigrants | Canada | 98.8 /100 | #88 | Exceptional $92,029 |
| Romanians | 98.8 /100 | #89 | Exceptional $91,994 |
| Assyrians/Chaldeans/Syriacs | 98.8 /100 | #90 | Exceptional $91,991 |
| Immigrants | Vietnam | 98.8 /100 | #91 | Exceptional $91,987 |
| Immigrants | Western Europe | 98.8 /100 | #92 | Exceptional $91,936 |
| Immigrants | Lebanon | 98.7 /100 | #93 | Exceptional $91,887 |
| Immigrants | North America | 98.7 /100 | #94 | Exceptional $91,860 |
| Armenians | 98.7 /100 | #95 | Exceptional $91,807 |
| Jordanians | 98.7 /100 | #96 | Exceptional $91,794 |
| Immigrants | Serbia | 98.6 /100 | #97 | Exceptional $91,730 |
| Immigrants | Southern Europe | 98.5 /100 | #98 | Exceptional $91,605 |