Immigrants from Zimbabwe vs Immigrants from Zaire Median Household Income
COMPARE
Immigrants from Zimbabwe
Immigrants from Zaire
Median Household Income
Median Household Income Comparison
Immigrants from Zimbabwe
Immigrants from Zaire
$89,496
MEDIAN HOUSEHOLD INCOME
94.4/ 100
METRIC RATING
123rd/ 347
METRIC RANK
$71,801
MEDIAN HOUSEHOLD INCOME
0.0/ 100
METRIC RATING
311th/ 347
METRIC RANK
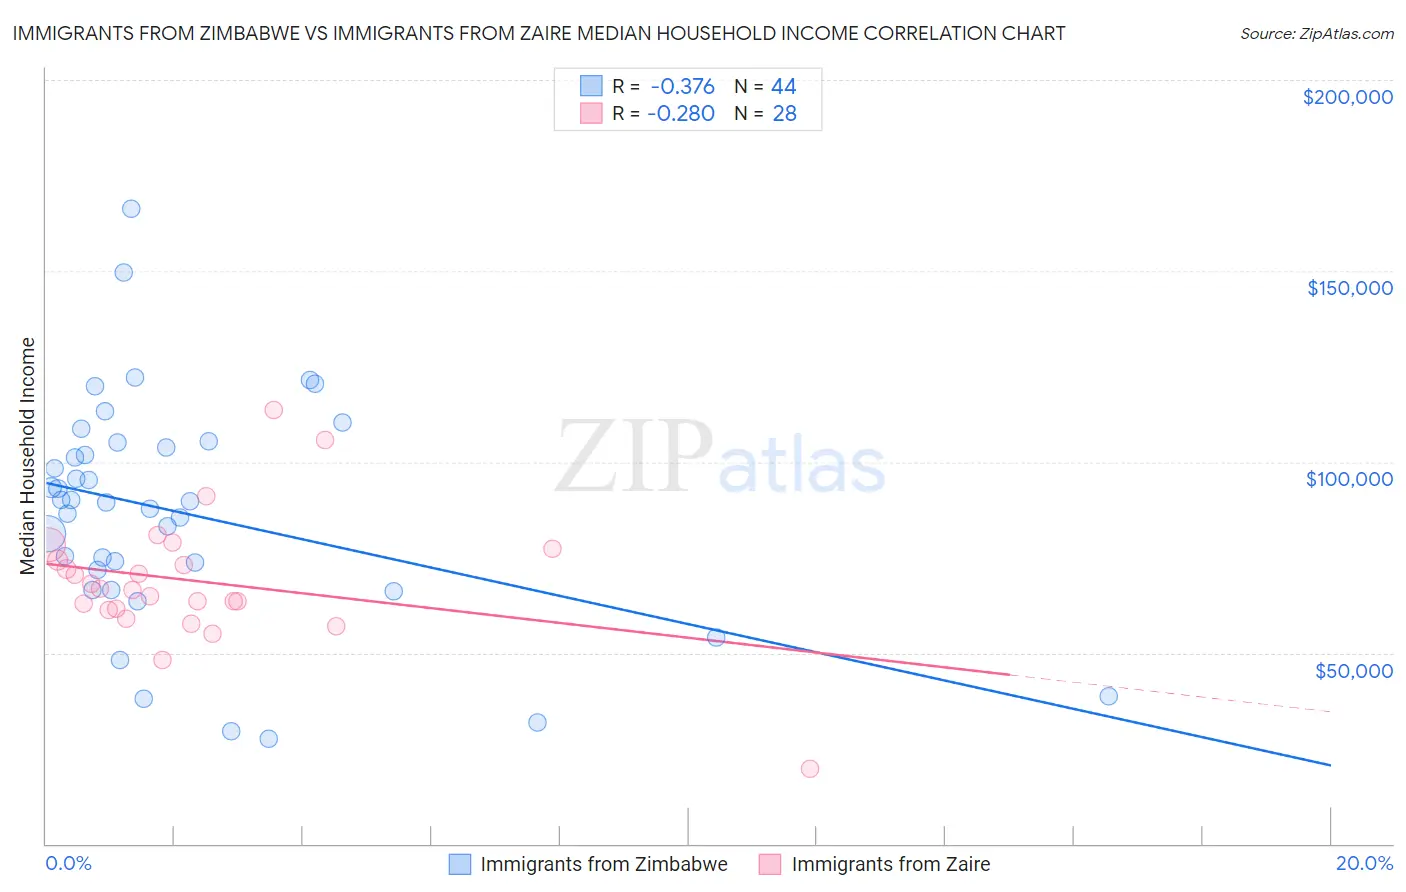
Immigrants from Zimbabwe vs Immigrants from Zaire Median Household Income Correlation Chart
The statistical analysis conducted on geographies consisting of 117,782,867 people shows a mild negative correlation between the proportion of Immigrants from Zimbabwe and median household income in the United States with a correlation coefficient (R) of -0.376 and weighted average of $89,496. Similarly, the statistical analysis conducted on geographies consisting of 107,241,682 people shows a weak negative correlation between the proportion of Immigrants from Zaire and median household income in the United States with a correlation coefficient (R) of -0.280 and weighted average of $71,801, a difference of 24.6%.
Median Household Income Correlation Summary
| Measurement | Immigrants from Zimbabwe | Immigrants from Zaire |
| Minimum | $27,656 | $19,722 |
| Maximum | $166,303 | $113,664 |
| Range | $138,647 | $93,942 |
| Mean | $86,538 | $68,739 |
| Median | $89,467 | $66,729 |
| Interquartile 25% (IQ1) | $69,146 | $61,417 |
| Interquartile 75% (IQ3) | $104,418 | $75,692 |
| Interquartile Range (IQR) | $35,272 | $14,275 |
| Standard Deviation (Sample) | $29,812 | $17,188 |
| Standard Deviation (Population) | $29,471 | $16,878 |
Similar Demographics by Median Household Income
Demographics Similar to Immigrants from Zimbabwe by Median Household Income
In terms of median household income, the demographic groups most similar to Immigrants from Zimbabwe are Immigrants from Jordan ($89,412, a difference of 0.090%), Ethiopian ($89,640, a difference of 0.16%), Pakistani ($89,638, a difference of 0.16%), Immigrants from Kuwait ($89,263, a difference of 0.26%), and Immigrants from North Macedonia ($89,741, a difference of 0.27%).
| Demographics | Rating | Rank | Median Household Income |
| Native Hawaiians | 95.7 /100 | #116 | Exceptional $89,919 |
| Taiwanese | 95.6 /100 | #117 | Exceptional $89,900 |
| Syrians | 95.4 /100 | #118 | Exceptional $89,830 |
| Albanians | 95.2 /100 | #119 | Exceptional $89,744 |
| Immigrants | North Macedonia | 95.2 /100 | #120 | Exceptional $89,741 |
| Ethiopians | 94.9 /100 | #121 | Exceptional $89,640 |
| Pakistanis | 94.8 /100 | #122 | Exceptional $89,638 |
| Immigrants | Zimbabwe | 94.4 /100 | #123 | Exceptional $89,496 |
| Immigrants | Jordan | 94.1 /100 | #124 | Exceptional $89,412 |
| Immigrants | Kuwait | 93.5 /100 | #125 | Exceptional $89,263 |
| Immigrants | Oceania | 92.9 /100 | #126 | Exceptional $89,100 |
| Immigrants | Peru | 92.5 /100 | #127 | Exceptional $89,010 |
| Portuguese | 92.3 /100 | #128 | Exceptional $88,976 |
| Brazilians | 92.1 /100 | #129 | Exceptional $88,934 |
| British | 92.0 /100 | #130 | Exceptional $88,914 |
Demographics Similar to Immigrants from Zaire by Median Household Income
In terms of median household income, the demographic groups most similar to Immigrants from Zaire are U.S. Virgin Islander ($71,853, a difference of 0.070%), Immigrants from Caribbean ($71,860, a difference of 0.080%), Immigrants from Honduras ($71,452, a difference of 0.49%), Yakama ($72,225, a difference of 0.59%), and Immigrants from Bahamas ($71,349, a difference of 0.63%).
| Demographics | Rating | Rank | Median Household Income |
| Immigrants | Haiti | 0.0 /100 | #304 | Tragic $72,599 |
| Hondurans | 0.0 /100 | #305 | Tragic $72,588 |
| Potawatomi | 0.0 /100 | #306 | Tragic $72,576 |
| Ute | 0.0 /100 | #307 | Tragic $72,402 |
| Yakama | 0.0 /100 | #308 | Tragic $72,225 |
| Immigrants | Caribbean | 0.0 /100 | #309 | Tragic $71,860 |
| U.S. Virgin Islanders | 0.0 /100 | #310 | Tragic $71,853 |
| Immigrants | Zaire | 0.0 /100 | #311 | Tragic $71,801 |
| Immigrants | Honduras | 0.0 /100 | #312 | Tragic $71,452 |
| Immigrants | Bahamas | 0.0 /100 | #313 | Tragic $71,349 |
| Dominicans | 0.0 /100 | #314 | Tragic $71,302 |
| Ottawa | 0.0 /100 | #315 | Tragic $70,984 |
| Apache | 0.0 /100 | #316 | Tragic $70,927 |
| Cajuns | 0.0 /100 | #317 | Tragic $70,605 |
| Chippewa | 0.0 /100 | #318 | Tragic $70,539 |