Immigrants from Western Asia vs Immigrants from Western Africa Householder Income Ages 25 - 44 years
COMPARE
Immigrants from Western Asia
Immigrants from Western Africa
Householder Income Ages 25 - 44 years
Householder Income Ages 25 - 44 years Comparison
Immigrants from Western Asia
Immigrants from Western Africa
$99,516
HOUSEHOLDER INCOME AGES 25 - 44 YEARS
94.0/ 100
METRIC RATING
114th/ 347
METRIC RANK
$85,676
HOUSEHOLDER INCOME AGES 25 - 44 YEARS
0.7/ 100
METRIC RATING
252nd/ 347
METRIC RANK
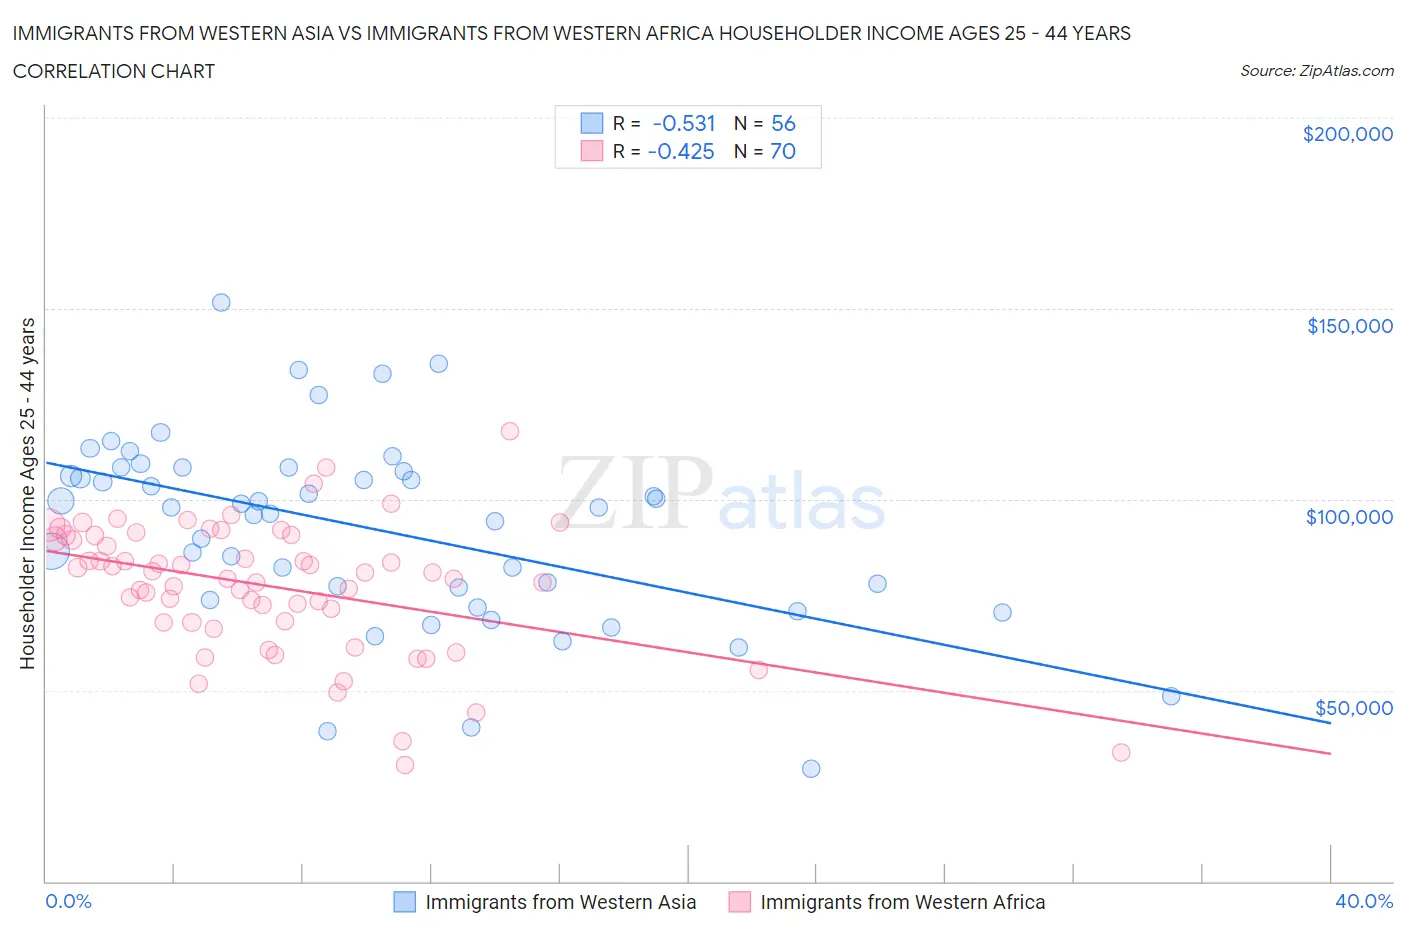
Immigrants from Western Asia vs Immigrants from Western Africa Householder Income Ages 25 - 44 years Correlation Chart
The statistical analysis conducted on geographies consisting of 403,414,437 people shows a substantial negative correlation between the proportion of Immigrants from Western Asia and household income with householder between the ages 25 and 44 in the United States with a correlation coefficient (R) of -0.531 and weighted average of $99,516. Similarly, the statistical analysis conducted on geographies consisting of 357,136,258 people shows a moderate negative correlation between the proportion of Immigrants from Western Africa and household income with householder between the ages 25 and 44 in the United States with a correlation coefficient (R) of -0.425 and weighted average of $85,676, a difference of 16.2%.
Householder Income Ages 25 - 44 years Correlation Summary
| Measurement | Immigrants from Western Asia | Immigrants from Western Africa |
| Minimum | $29,492 | $30,517 |
| Maximum | $151,438 | $117,804 |
| Range | $121,946 | $87,287 |
| Mean | $92,165 | $77,170 |
| Median | $97,998 | $80,034 |
| Interquartile 25% (IQ1) | $75,153 | $67,813 |
| Interquartile 75% (IQ3) | $107,722 | $90,526 |
| Interquartile Range (IQR) | $32,569 | $22,713 |
| Standard Deviation (Sample) | $24,816 | $17,090 |
| Standard Deviation (Population) | $24,593 | $16,967 |
Similar Demographics by Householder Income Ages 25 - 44 years
Demographics Similar to Immigrants from Western Asia by Householder Income Ages 25 - 44 years
In terms of householder income ages 25 - 44 years, the demographic groups most similar to Immigrants from Western Asia are Carpatho Rusyn ($99,449, a difference of 0.070%), Tongan ($99,604, a difference of 0.090%), Portuguese ($99,429, a difference of 0.090%), Polish ($99,685, a difference of 0.17%), and Immigrants from Northern Africa ($99,232, a difference of 0.29%).
| Demographics | Rating | Rank | Householder Income Ages 25 - 44 years |
| Northern Europeans | 96.3 /100 | #107 | Exceptional $100,457 |
| Immigrants | South Eastern Asia | 96.0 /100 | #108 | Exceptional $100,283 |
| Immigrants | North Macedonia | 95.6 /100 | #109 | Exceptional $100,101 |
| Immigrants | Afghanistan | 95.3 /100 | #110 | Exceptional $99,977 |
| Chileans | 95.1 /100 | #111 | Exceptional $99,900 |
| Poles | 94.5 /100 | #112 | Exceptional $99,685 |
| Tongans | 94.2 /100 | #113 | Exceptional $99,604 |
| Immigrants | Western Asia | 94.0 /100 | #114 | Exceptional $99,516 |
| Carpatho Rusyns | 93.7 /100 | #115 | Exceptional $99,449 |
| Portuguese | 93.7 /100 | #116 | Exceptional $99,429 |
| Immigrants | Northern Africa | 93.0 /100 | #117 | Exceptional $99,232 |
| Syrians | 92.9 /100 | #118 | Exceptional $99,215 |
| Jordanians | 92.8 /100 | #119 | Exceptional $99,186 |
| Swedes | 92.7 /100 | #120 | Exceptional $99,136 |
| Peruvians | 91.7 /100 | #121 | Exceptional $98,886 |
Demographics Similar to Immigrants from Western Africa by Householder Income Ages 25 - 44 years
In terms of householder income ages 25 - 44 years, the demographic groups most similar to Immigrants from Western Africa are Cape Verdean ($85,758, a difference of 0.10%), British West Indian ($85,565, a difference of 0.13%), Immigrants from Laos ($85,553, a difference of 0.14%), Pennsylvania German ($85,836, a difference of 0.19%), and French American Indian ($85,899, a difference of 0.26%).
| Demographics | Rating | Rank | Householder Income Ages 25 - 44 years |
| Immigrants | El Salvador | 1.4 /100 | #245 | Tragic $86,913 |
| Immigrants | Burma/Myanmar | 1.3 /100 | #246 | Tragic $86,736 |
| Immigrants | Nigeria | 1.2 /100 | #247 | Tragic $86,589 |
| Immigrants | Sudan | 0.9 /100 | #248 | Tragic $86,109 |
| French American Indians | 0.8 /100 | #249 | Tragic $85,899 |
| Pennsylvania Germans | 0.8 /100 | #250 | Tragic $85,836 |
| Cape Verdeans | 0.8 /100 | #251 | Tragic $85,758 |
| Immigrants | Western Africa | 0.7 /100 | #252 | Tragic $85,676 |
| British West Indians | 0.7 /100 | #253 | Tragic $85,565 |
| Immigrants | Laos | 0.7 /100 | #254 | Tragic $85,553 |
| German Russians | 0.6 /100 | #255 | Tragic $85,220 |
| Central Americans | 0.5 /100 | #256 | Tragic $85,144 |
| Mexican American Indians | 0.5 /100 | #257 | Tragic $85,066 |
| Immigrants | Nicaragua | 0.5 /100 | #258 | Tragic $84,914 |
| Immigrants | Senegal | 0.5 /100 | #259 | Tragic $84,848 |