Immigrants from Venezuela vs Trinidadian and Tobagonian Householder Income Ages 45 - 64 years
COMPARE
Immigrants from Venezuela
Trinidadian and Tobagonian
Householder Income Ages 45 - 64 years
Householder Income Ages 45 - 64 years Comparison
Immigrants from Venezuela
Trinidadians and Tobagonians
$95,342
HOUSEHOLDER INCOME AGES 45 - 64 YEARS
7.6/ 100
METRIC RATING
216th/ 347
METRIC RANK
$91,357
HOUSEHOLDER INCOME AGES 45 - 64 YEARS
1.1/ 100
METRIC RATING
241st/ 347
METRIC RANK
Immigrants from Venezuela vs Trinidadian and Tobagonian Householder Income Ages 45 - 64 years Correlation Chart
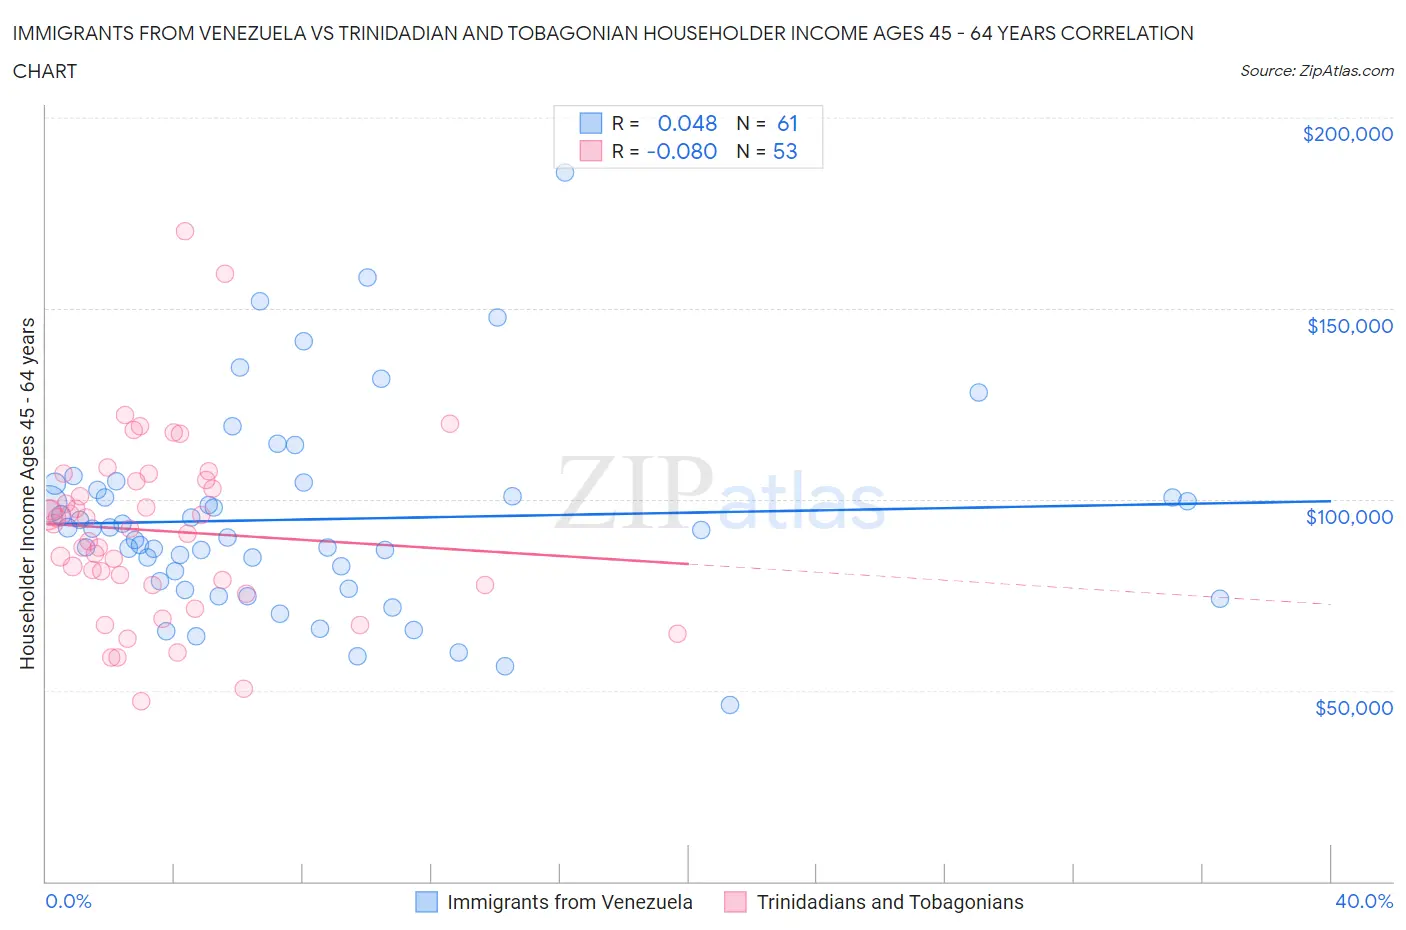
The statistical analysis conducted on geographies consisting of 287,624,834 people shows no correlation between the proportion of Immigrants from Venezuela and household income with householder between the ages 45 and 64 in the United States with a correlation coefficient (R) of 0.048 and weighted average of $95,342. Similarly, the statistical analysis conducted on geographies consisting of 219,574,386 people shows a slight negative correlation between the proportion of Trinidadians and Tobagonians and household income with householder between the ages 45 and 64 in the United States with a correlation coefficient (R) of -0.080 and weighted average of $91,357, a difference of 4.4%.
Householder Income Ages 45 - 64 years Correlation Summary
| Measurement | Immigrants from Venezuela | Trinidadian and Tobagonian |
| Minimum | $46,250 | $47,269 |
| Maximum | $185,667 | $170,234 |
| Range | $139,417 | $122,965 |
| Mean | $94,774 | $91,778 |
| Median | $91,875 | $92,441 |
| Interquartile 25% (IQ1) | $77,515 | $77,664 |
| Interquartile 75% (IQ3) | $103,326 | $104,934 |
| Interquartile Range (IQR) | $25,811 | $27,270 |
| Standard Deviation (Sample) | $26,075 | $23,595 |
| Standard Deviation (Population) | $25,861 | $23,371 |
Similar Demographics by Householder Income Ages 45 - 64 years
Demographics Similar to Immigrants from Venezuela by Householder Income Ages 45 - 64 years
In terms of householder income ages 45 - 64 years, the demographic groups most similar to Immigrants from Venezuela are Nigerian ($95,492, a difference of 0.16%), Immigrants from Ghana ($94,982, a difference of 0.38%), Delaware ($94,914, a difference of 0.45%), Immigrants from Armenia ($94,863, a difference of 0.50%), and Salvadoran ($94,842, a difference of 0.53%).
| Demographics | Rating | Rank | Householder Income Ages 45 - 64 years |
| Japanese | 14.8 /100 | #209 | Poor $96,834 |
| Tsimshian | 14.5 /100 | #210 | Poor $96,783 |
| Immigrants | Cambodia | 13.0 /100 | #211 | Poor $96,537 |
| Venezuelans | 12.6 /100 | #212 | Poor $96,460 |
| Immigrants | Uruguay | 10.7 /100 | #213 | Poor $96,086 |
| Panamanians | 10.6 /100 | #214 | Poor $96,066 |
| Nigerians | 8.2 /100 | #215 | Tragic $95,492 |
| Immigrants | Venezuela | 7.6 /100 | #216 | Tragic $95,342 |
| Immigrants | Ghana | 6.4 /100 | #217 | Tragic $94,982 |
| Delaware | 6.2 /100 | #218 | Tragic $94,914 |
| Immigrants | Armenia | 6.1 /100 | #219 | Tragic $94,863 |
| Salvadorans | 6.0 /100 | #220 | Tragic $94,842 |
| Immigrants | Nigeria | 5.9 /100 | #221 | Tragic $94,804 |
| Malaysians | 5.2 /100 | #222 | Tragic $94,517 |
| Immigrants | Nonimmigrants | 5.0 /100 | #223 | Tragic $94,448 |
Demographics Similar to Trinidadians and Tobagonians by Householder Income Ages 45 - 64 years
In terms of householder income ages 45 - 64 years, the demographic groups most similar to Trinidadians and Tobagonians are Inupiat ($91,355, a difference of 0.0%), Immigrants from Trinidad and Tobago ($91,347, a difference of 0.010%), Immigrants from Burma/Myanmar ($91,385, a difference of 0.030%), Immigrants from Middle Africa ($91,293, a difference of 0.070%), and Immigrants from Ecuador ($91,462, a difference of 0.12%).
| Demographics | Rating | Rank | Householder Income Ages 45 - 64 years |
| Immigrants | El Salvador | 2.7 /100 | #234 | Tragic $93,176 |
| Nicaraguans | 2.0 /100 | #235 | Tragic $92,554 |
| Immigrants | Western Africa | 1.8 /100 | #236 | Tragic $92,384 |
| Immigrants | Bangladesh | 1.7 /100 | #237 | Tragic $92,208 |
| Pennsylvania Germans | 1.5 /100 | #238 | Tragic $91,956 |
| Immigrants | Ecuador | 1.2 /100 | #239 | Tragic $91,462 |
| Immigrants | Burma/Myanmar | 1.1 /100 | #240 | Tragic $91,385 |
| Trinidadians and Tobagonians | 1.1 /100 | #241 | Tragic $91,357 |
| Inupiat | 1.1 /100 | #242 | Tragic $91,355 |
| Immigrants | Trinidad and Tobago | 1.1 /100 | #243 | Tragic $91,347 |
| Immigrants | Middle Africa | 1.1 /100 | #244 | Tragic $91,293 |
| Guyanese | 0.9 /100 | #245 | Tragic $90,966 |
| Central Americans | 0.9 /100 | #246 | Tragic $90,951 |
| Alaskan Athabascans | 0.9 /100 | #247 | Tragic $90,951 |
| Immigrants | Laos | 0.9 /100 | #248 | Tragic $90,909 |