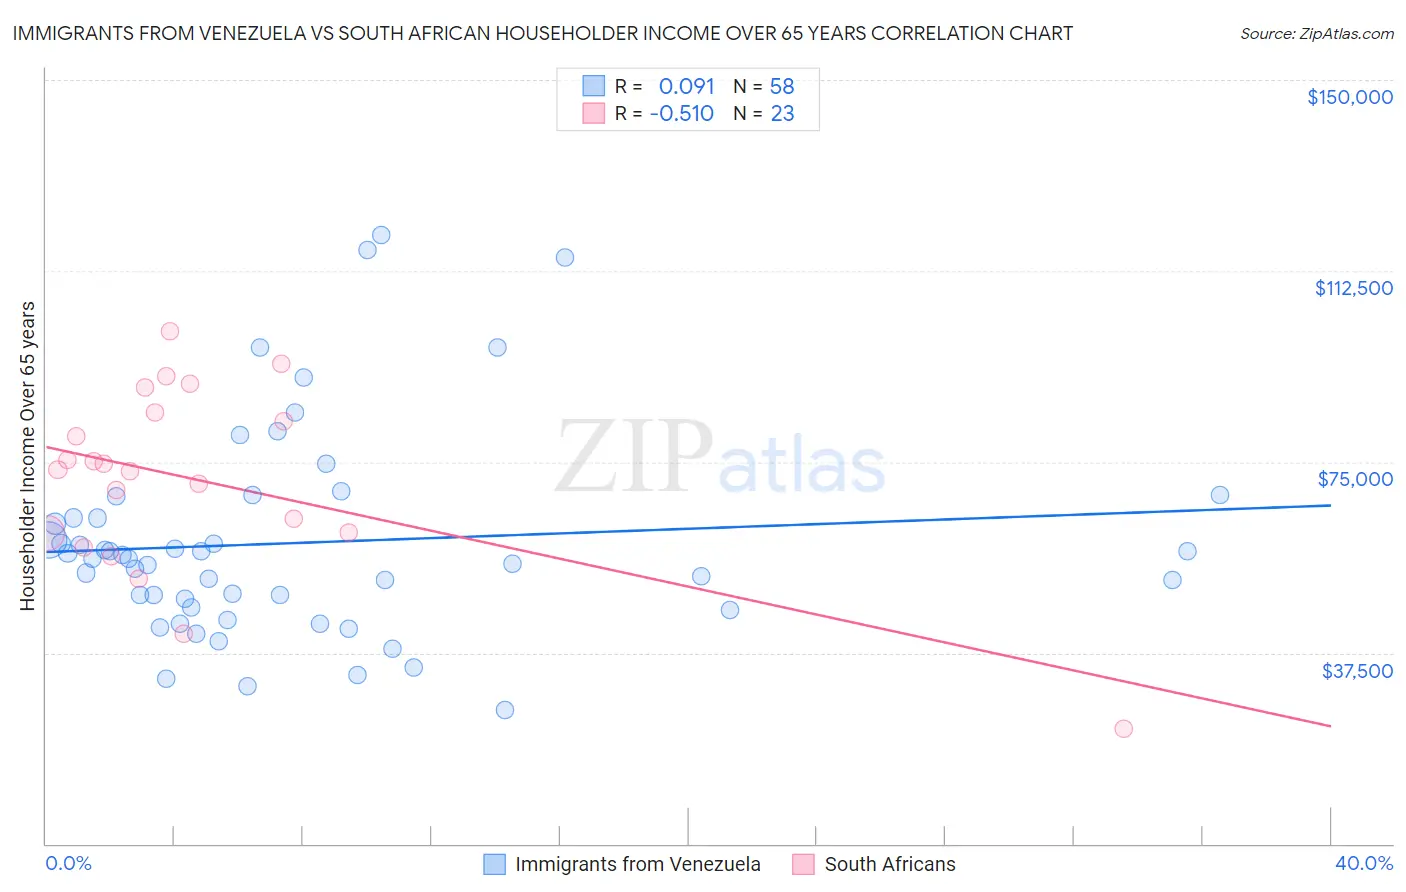
Immigrants from Venezuela vs South African Householder Income Over 65 years
COMPARE
Immigrants from Venezuela
South African
Householder Income Over 65 years
Householder Income Over 65 years Comparison
Immigrants from Venezuela
South Africans
$57,371
HOUSEHOLDER INCOME OVER 65 YEARS
2.3/ 100
METRIC RATING
232nd/ 347
METRIC RANK
$65,652
HOUSEHOLDER INCOME OVER 65 YEARS
99.3/ 100
METRIC RATING
66th/ 347
METRIC RANK
Immigrants from Venezuela vs South African Householder Income Over 65 years Correlation Chart
The statistical analysis conducted on geographies consisting of 287,361,159 people shows a slight positive correlation between the proportion of Immigrants from Venezuela and household income with householder over the age of 65 in the United States with a correlation coefficient (R) of 0.091 and weighted average of $57,371. Similarly, the statistical analysis conducted on geographies consisting of 182,279,663 people shows a substantial negative correlation between the proportion of South Africans and household income with householder over the age of 65 in the United States with a correlation coefficient (R) of -0.510 and weighted average of $65,652, a difference of 14.4%.
Householder Income Over 65 years Correlation Summary
| Measurement | Immigrants from Venezuela | South African |
| Minimum | $26,376 | $22,500 |
| Maximum | $119,643 | $100,655 |
| Range | $93,267 | $78,155 |
| Mean | $59,079 | $71,429 |
| Median | $55,975 | $73,431 |
| Interquartile 25% (IQ1) | $46,366 | $61,016 |
| Interquartile 75% (IQ3) | $63,983 | $84,692 |
| Interquartile Range (IQR) | $17,617 | $23,677 |
| Standard Deviation (Sample) | $20,462 | $18,184 |
| Standard Deviation (Population) | $20,285 | $17,784 |
Similar Demographics by Householder Income Over 65 years
Demographics Similar to Immigrants from Venezuela by Householder Income Over 65 years
In terms of householder income over 65 years, the demographic groups most similar to Immigrants from Venezuela are Nonimmigrants ($57,426, a difference of 0.090%), Immigrants from Cambodia ($57,580, a difference of 0.36%), Immigrants from Western Africa ($57,119, a difference of 0.44%), Immigrants from Burma/Myanmar ($57,114, a difference of 0.45%), and Immigrants from Colombia ($57,658, a difference of 0.50%).
| Demographics | Rating | Rank | Householder Income Over 65 years |
| Venezuelans | 4.4 /100 | #225 | Tragic $58,026 |
| French Canadians | 4.2 /100 | #226 | Tragic $57,975 |
| Japanese | 3.9 /100 | #227 | Tragic $57,919 |
| Immigrants | Albania | 3.6 /100 | #228 | Tragic $57,828 |
| Immigrants | Colombia | 3.0 /100 | #229 | Tragic $57,658 |
| Immigrants | Cambodia | 2.8 /100 | #230 | Tragic $57,580 |
| Immigrants | Nonimmigrants | 2.4 /100 | #231 | Tragic $57,426 |
| Immigrants | Venezuela | 2.3 /100 | #232 | Tragic $57,371 |
| Immigrants | Western Africa | 1.7 /100 | #233 | Tragic $57,119 |
| Immigrants | Burma/Myanmar | 1.7 /100 | #234 | Tragic $57,114 |
| Spanish Americans | 1.6 /100 | #235 | Tragic $57,021 |
| Immigrants | Uruguay | 1.5 /100 | #236 | Tragic $56,975 |
| Immigrants | Panama | 1.5 /100 | #237 | Tragic $56,944 |
| Fijians | 1.2 /100 | #238 | Tragic $56,768 |
| Immigrants | Laos | 1.2 /100 | #239 | Tragic $56,722 |
Demographics Similar to South Africans by Householder Income Over 65 years
In terms of householder income over 65 years, the demographic groups most similar to South Africans are Immigrants from England ($65,715, a difference of 0.10%), Immigrants from Malaysia ($65,497, a difference of 0.24%), Zimbabwean ($65,854, a difference of 0.31%), Egyptian ($65,441, a difference of 0.32%), and Marshallese ($65,874, a difference of 0.34%).
| Demographics | Rating | Rank | Householder Income Over 65 years |
| Immigrants | Norway | 99.5 /100 | #59 | Exceptional $66,118 |
| Immigrants | Lithuania | 99.5 /100 | #60 | Exceptional $66,087 |
| Maltese | 99.5 /100 | #61 | Exceptional $66,027 |
| Immigrants | Sierra Leone | 99.5 /100 | #62 | Exceptional $66,009 |
| Marshallese | 99.4 /100 | #63 | Exceptional $65,874 |
| Zimbabweans | 99.4 /100 | #64 | Exceptional $65,854 |
| Immigrants | England | 99.3 /100 | #65 | Exceptional $65,715 |
| South Africans | 99.3 /100 | #66 | Exceptional $65,652 |
| Immigrants | Malaysia | 99.1 /100 | #67 | Exceptional $65,497 |
| Egyptians | 99.1 /100 | #68 | Exceptional $65,441 |
| Samoans | 99.1 /100 | #69 | Exceptional $65,427 |
| Mongolians | 99.0 /100 | #70 | Exceptional $65,326 |
| Greeks | 98.9 /100 | #71 | Exceptional $65,306 |
| Argentineans | 98.9 /100 | #72 | Exceptional $65,246 |
| Immigrants | Ethiopia | 98.9 /100 | #73 | Exceptional $65,238 |