Immigrants from Uruguay vs Burmese Median Male Earnings
COMPARE
Immigrants from Uruguay
Burmese
Median Male Earnings
Median Male Earnings Comparison
Immigrants from Uruguay
Burmese
$52,860
MEDIAN MALE EARNINGS
16.8/ 100
METRIC RATING
202nd/ 347
METRIC RANK
$65,236
MEDIAN MALE EARNINGS
100.0/ 100
METRIC RATING
22nd/ 347
METRIC RANK
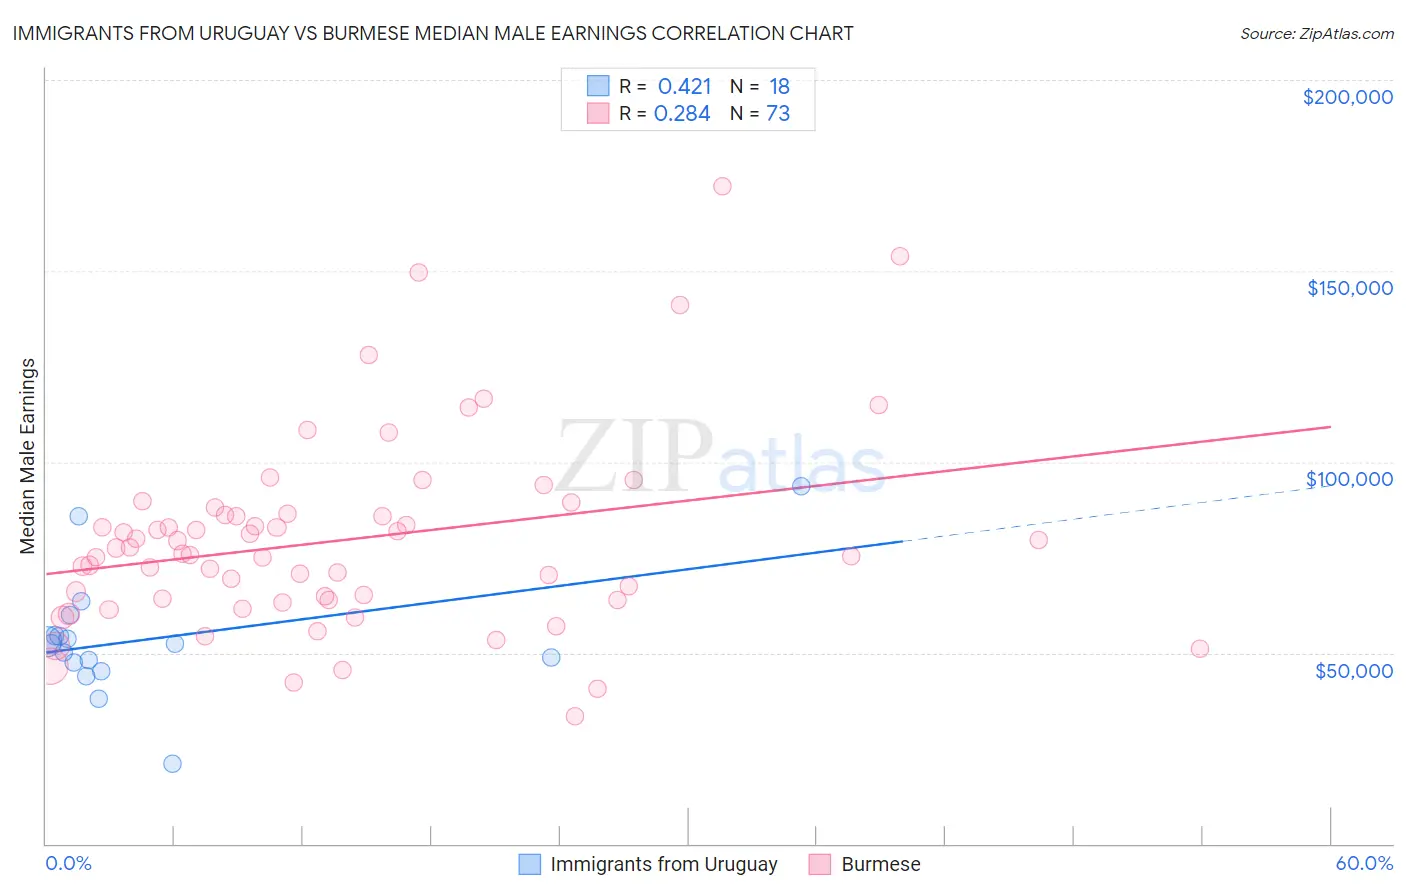
Immigrants from Uruguay vs Burmese Median Male Earnings Correlation Chart
The statistical analysis conducted on geographies consisting of 133,249,563 people shows a moderate positive correlation between the proportion of Immigrants from Uruguay and median male earnings in the United States with a correlation coefficient (R) of 0.421 and weighted average of $52,860. Similarly, the statistical analysis conducted on geographies consisting of 465,224,564 people shows a weak positive correlation between the proportion of Burmese and median male earnings in the United States with a correlation coefficient (R) of 0.284 and weighted average of $65,236, a difference of 23.4%.
Median Male Earnings Correlation Summary
| Measurement | Immigrants from Uruguay | Burmese |
| Minimum | $20,946 | $33,399 |
| Maximum | $93,710 | $172,143 |
| Range | $72,764 | $138,744 |
| Mean | $53,632 | $79,644 |
| Median | $52,453 | $75,943 |
| Interquartile 25% (IQ1) | $47,598 | $63,717 |
| Interquartile 75% (IQ3) | $54,536 | $86,383 |
| Interquartile Range (IQR) | $6,938 | $22,666 |
| Standard Deviation (Sample) | $16,044 | $25,713 |
| Standard Deviation (Population) | $15,592 | $25,536 |
Similar Demographics by Median Male Earnings
Demographics Similar to Immigrants from Uruguay by Median Male Earnings
In terms of median male earnings, the demographic groups most similar to Immigrants from Uruguay are Immigrants from Bosnia and Herzegovina ($52,869, a difference of 0.020%), Panamanian ($52,835, a difference of 0.050%), Immigrants from Thailand ($52,908, a difference of 0.090%), Ghanaian ($52,810, a difference of 0.10%), and Immigrants from Colombia ($52,725, a difference of 0.26%).
| Demographics | Rating | Rank | Median Male Earnings |
| Immigrants | Azores | 27.5 /100 | #195 | Fair $53,503 |
| Immigrants | Africa | 26.6 /100 | #196 | Fair $53,457 |
| Immigrants | Kenya | 26.0 /100 | #197 | Fair $53,427 |
| Immigrants | Costa Rica | 22.6 /100 | #198 | Fair $53,237 |
| Tongans | 22.3 /100 | #199 | Fair $53,218 |
| Immigrants | Thailand | 17.5 /100 | #200 | Poor $52,908 |
| Immigrants | Bosnia and Herzegovina | 16.9 /100 | #201 | Poor $52,869 |
| Immigrants | Uruguay | 16.8 /100 | #202 | Poor $52,860 |
| Panamanians | 16.5 /100 | #203 | Poor $52,835 |
| Ghanaians | 16.1 /100 | #204 | Poor $52,810 |
| Immigrants | Colombia | 15.0 /100 | #205 | Poor $52,725 |
| Immigrants | Iraq | 14.5 /100 | #206 | Poor $52,681 |
| Vietnamese | 12.7 /100 | #207 | Poor $52,525 |
| Venezuelans | 12.5 /100 | #208 | Poor $52,510 |
| Bermudans | 12.1 /100 | #209 | Poor $52,465 |
Demographics Similar to Burmese by Median Male Earnings
In terms of median male earnings, the demographic groups most similar to Burmese are Immigrants from Korea ($65,079, a difference of 0.24%), Immigrants from Sweden ($65,406, a difference of 0.26%), Immigrants from Northern Europe ($64,987, a difference of 0.38%), Immigrants from Japan ($65,518, a difference of 0.43%), and Cypriot ($65,549, a difference of 0.48%).
| Demographics | Rating | Rank | Median Male Earnings |
| Immigrants | Eastern Asia | 100.0 /100 | #15 | Exceptional $66,903 |
| Eastern Europeans | 100.0 /100 | #16 | Exceptional $66,472 |
| Immigrants | Belgium | 100.0 /100 | #17 | Exceptional $66,125 |
| Indians (Asian) | 100.0 /100 | #18 | Exceptional $66,078 |
| Cypriots | 100.0 /100 | #19 | Exceptional $65,549 |
| Immigrants | Japan | 100.0 /100 | #20 | Exceptional $65,518 |
| Immigrants | Sweden | 100.0 /100 | #21 | Exceptional $65,406 |
| Burmese | 100.0 /100 | #22 | Exceptional $65,236 |
| Immigrants | Korea | 100.0 /100 | #23 | Exceptional $65,079 |
| Immigrants | Northern Europe | 100.0 /100 | #24 | Exceptional $64,987 |
| Immigrants | Denmark | 100.0 /100 | #25 | Exceptional $64,625 |
| Turks | 100.0 /100 | #26 | Exceptional $64,253 |
| Immigrants | Switzerland | 100.0 /100 | #27 | Exceptional $63,944 |
| Russians | 100.0 /100 | #28 | Exceptional $63,939 |
| Asians | 100.0 /100 | #29 | Exceptional $63,827 |