Immigrants from Ukraine vs Malaysian Householder Income Under 25 years
COMPARE
Immigrants from Ukraine
Malaysian
Householder Income Under 25 years
Householder Income Under 25 years Comparison
Immigrants from Ukraine
Malaysians
$55,447
HOUSEHOLDER INCOME UNDER 25 YEARS
100.0/ 100
METRIC RATING
55th/ 347
METRIC RANK
$51,615
HOUSEHOLDER INCOME UNDER 25 YEARS
19.7/ 100
METRIC RATING
190th/ 347
METRIC RANK
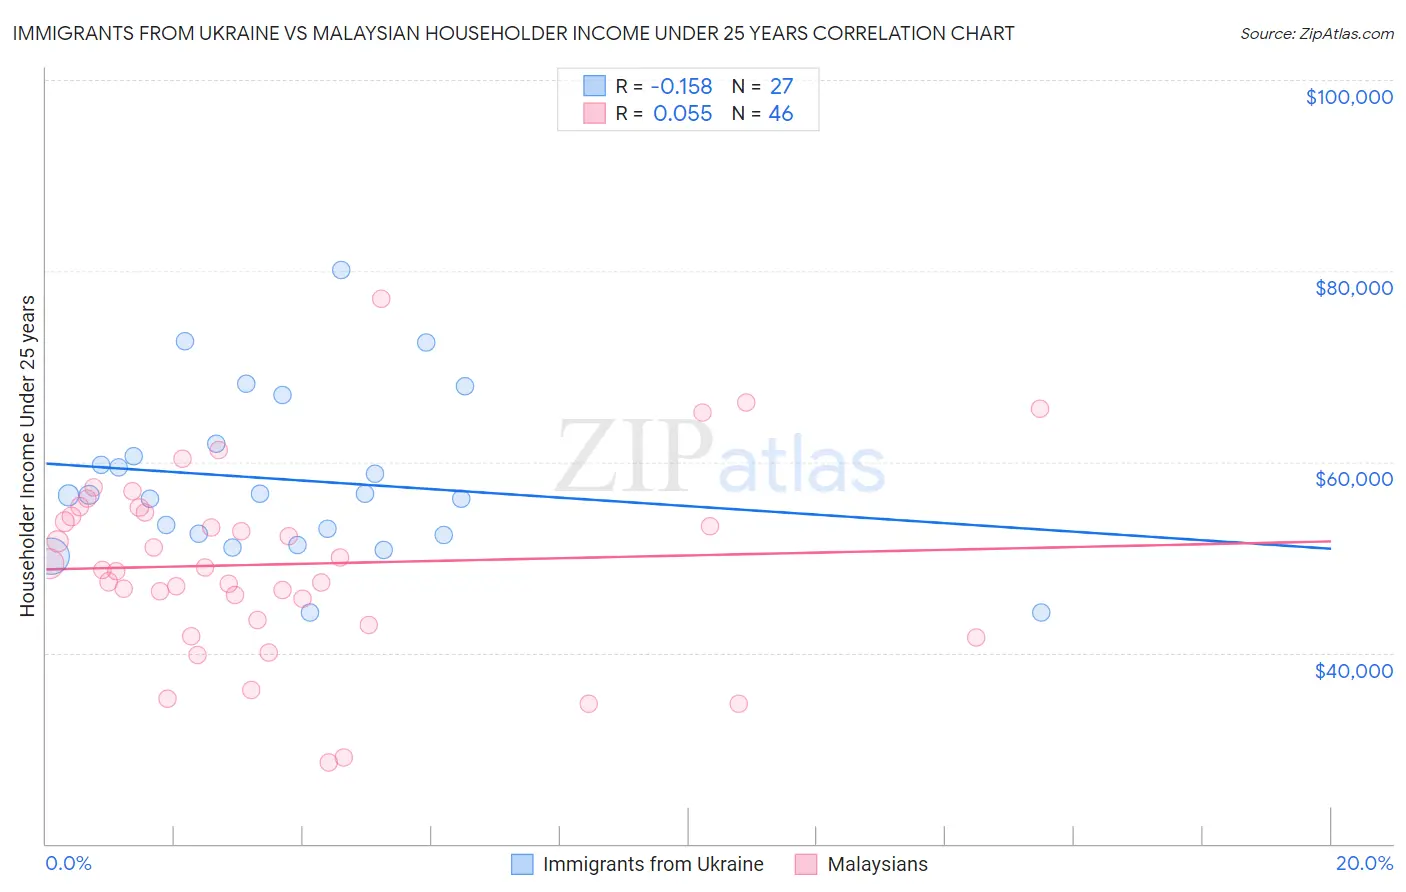
Immigrants from Ukraine vs Malaysian Householder Income Under 25 years Correlation Chart
The statistical analysis conducted on geographies consisting of 247,734,480 people shows a poor negative correlation between the proportion of Immigrants from Ukraine and household income with householder under the age of 25 in the United States with a correlation coefficient (R) of -0.158 and weighted average of $55,447. Similarly, the statistical analysis conducted on geographies consisting of 207,003,790 people shows a slight positive correlation between the proportion of Malaysians and household income with householder under the age of 25 in the United States with a correlation coefficient (R) of 0.055 and weighted average of $51,615, a difference of 7.4%.
Householder Income Under 25 years Correlation Summary
| Measurement | Immigrants from Ukraine | Malaysian |
| Minimum | $44,212 | $28,500 |
| Maximum | $80,041 | $77,081 |
| Range | $35,830 | $48,581 |
| Mean | $58,153 | $49,286 |
| Median | $56,546 | $48,791 |
| Interquartile 25% (IQ1) | $52,321 | $43,424 |
| Interquartile 75% (IQ3) | $61,864 | $54,664 |
| Interquartile Range (IQR) | $9,543 | $11,240 |
| Standard Deviation (Sample) | $8,615 | $9,769 |
| Standard Deviation (Population) | $8,454 | $9,663 |
Similar Demographics by Householder Income Under 25 years
Demographics Similar to Immigrants from Ukraine by Householder Income Under 25 years
In terms of householder income under 25 years, the demographic groups most similar to Immigrants from Ukraine are Sri Lankan ($55,470, a difference of 0.040%), Immigrants from Poland ($55,474, a difference of 0.050%), Salvadoran ($55,412, a difference of 0.060%), Immigrants from Romania ($55,522, a difference of 0.13%), and Immigrants from Indonesia ($55,521, a difference of 0.13%).
| Demographics | Rating | Rank | Householder Income Under 25 years |
| Immigrants | Vietnam | 100.0 /100 | #48 | Exceptional $55,562 |
| Iranians | 100.0 /100 | #49 | Exceptional $55,548 |
| Puget Sound Salish | 100.0 /100 | #50 | Exceptional $55,543 |
| Immigrants | Romania | 100.0 /100 | #51 | Exceptional $55,522 |
| Immigrants | Indonesia | 100.0 /100 | #52 | Exceptional $55,521 |
| Immigrants | Poland | 100.0 /100 | #53 | Exceptional $55,474 |
| Sri Lankans | 100.0 /100 | #54 | Exceptional $55,470 |
| Immigrants | Ukraine | 100.0 /100 | #55 | Exceptional $55,447 |
| Salvadorans | 100.0 /100 | #56 | Exceptional $55,412 |
| Soviet Union | 100.0 /100 | #57 | Exceptional $55,340 |
| Guyanese | 99.9 /100 | #58 | Exceptional $55,210 |
| Native Hawaiians | 99.9 /100 | #59 | Exceptional $55,158 |
| Immigrants | Lithuania | 99.9 /100 | #60 | Exceptional $55,028 |
| Immigrants | Europe | 99.9 /100 | #61 | Exceptional $55,022 |
| Immigrants | Uzbekistan | 99.8 /100 | #62 | Exceptional $54,846 |
Demographics Similar to Malaysians by Householder Income Under 25 years
In terms of householder income under 25 years, the demographic groups most similar to Malaysians are Panamanian ($51,611, a difference of 0.010%), West Indian ($51,583, a difference of 0.060%), Immigrants from Eritrea ($51,574, a difference of 0.080%), Croatian ($51,662, a difference of 0.090%), and Northern European ($51,678, a difference of 0.12%).
| Demographics | Rating | Rank | Householder Income Under 25 years |
| Mexican American Indians | 27.0 /100 | #183 | Fair $51,783 |
| Paiute | 25.1 /100 | #184 | Fair $51,743 |
| Immigrants | Latvia | 24.8 /100 | #185 | Fair $51,737 |
| Alaskan Athabascans | 23.8 /100 | #186 | Fair $51,713 |
| Immigrants | South Africa | 23.4 /100 | #187 | Fair $51,705 |
| Northern Europeans | 22.2 /100 | #188 | Fair $51,678 |
| Croatians | 21.6 /100 | #189 | Fair $51,662 |
| Malaysians | 19.7 /100 | #190 | Poor $51,615 |
| Panamanians | 19.5 /100 | #191 | Poor $51,611 |
| West Indians | 18.5 /100 | #192 | Poor $51,583 |
| Immigrants | Eritrea | 18.1 /100 | #193 | Poor $51,574 |
| Guatemalans | 16.4 /100 | #194 | Poor $51,525 |
| Estonians | 16.4 /100 | #195 | Poor $51,523 |
| Palestinians | 16.1 /100 | #196 | Poor $51,515 |
| Pima | 15.7 /100 | #197 | Poor $51,503 |