Immigrants from Uganda vs Thai Median Family Income

COMPARE

Immigrants from Uganda
Race
Ancestry
AfghanAfricanAlaska NativeAlaskan AthabascanAlbanianAleutAlsatianAmericanApacheArabArapahoArgentineanArmenianAssyrian/Chaldean/SyriacAustralianAustrianBahamianBangladeshiBarbadianBasqueBelgianBelizeanBermudanBhutaneseBlackfeetBolivianBrazilianBritishBritish West IndianBulgarianBurmeseCajunCambodianCanadianCape VerdeanCarpatho RusynCelticCentral AmericanCentral American IndianCherokeeCheyenneChickasawChileanChineseChippewaChoctawColombianColvilleComancheCosta RicanCreeCreekCroatianCrowCubanCypriotCzechCzechoslovakianDanishDelawareDominicanDutchDutch West IndianEastern EuropeanEcuadorianEgyptianEnglishEstonianEthiopianEuropeanFijianFilipinoFinnishFrenchFrench American IndianFrench CanadianGermanGerman RussianGhanaianGreekGuamanian/ChamorroGuatemalanGuyaneseHaitianHmongHonduranHopiHoumaHungarianIcelanderIndian (Asian)IndonesianInupiatIranianIraqiIrishIroquoisIsraeliItalianJamaicanJapaneseJordanianKenyanKiowaKoreanLaotianLatvianLebaneseLiberianLithuanianLumbeeLuxembourgerMacedonianMalaysianMalteseMarshalleseMenomineeMexicanMexican American IndianMongolianMoroccanNative HawaiianNavajoNepaleseNew ZealanderNicaraguanNigerianNorthern EuropeanNorwegianOkinawanOsageOttawaPaiutePakistaniPalestinianPanamanianParaguayanPennsylvania GermanPeruvianPimaPolishPortuguesePotawatomiPuebloPuerto RicanPuget Sound SalishRomanianRussianSalvadoranSamoanScandinavianScotch-IrishScottishSeminoleSenegaleseSerbianShoshoneSierra LeoneanSiouxSlavicSlovakSloveneSomaliSouth AfricanSouth AmericanSouth American IndianSoviet UnionSpaniardSpanishSpanish AmericanSpanish American IndianSri LankanSubsaharan AfricanSudaneseSwedishSwissSyrianTaiwaneseTlingit-HaidaTohono O'OdhamTonganTrinidadian and TobagonianTsimshianTurkishU.S. Virgin IslanderUgandanUkrainianUruguayanUteVenezuelanVietnameseWelshWest IndianYakamaYaquiYugoslavianYumanYup'ikZimbabwean
Immigration
NonimmigrantsImmigrantsAfghanistanAfricaAlbaniaArgentinaArmeniaAsiaAustraliaAustriaBahamasBangladeshBarbadosBelarusBelgiumBelizeBoliviaBosnia and HerzegovinaBrazilBulgariaBurma/MyanmarCabo VerdeCambodiaCameroonCanadaCaribbeanCentral AmericaChileChinaColombiaCongoCosta RicaCroatiaCubaCzechoslovakiaDenmarkDominicaDominican RepublicEastern AfricaEastern AsiaEastern EuropeEcuadorEgyptEl SalvadorEnglandEritreaEthiopiaEuropeFijiFranceGermanyGhanaGreeceGrenadaGuatemalaGuyanaHaitiHondurasHong KongHungaryIndiaIndonesiaIranIraqIrelandIsraelItalyJamaicaJapanJordanKazakhstanKenyaKoreaKuwaitLaosLatin AmericaLatviaLebanonLiberiaLithuaniaMalaysiaMexicoMicronesiaMiddle AfricaMoldovaMoroccoNepalNetherlandsNicaraguaNigeriaNorth AmericaNorth MacedoniaNorthern AfricaNorthern EuropeNorwayOceaniaPakistanPanamaPeruPhilippinesPolandPortugalRomaniaRussiaSaudi ArabiaScotlandSenegalSerbiaSierra LeoneSingaporeSomaliaSouth AfricaSouth AmericaSouth Central AsiaSouth Eastern AsiaSouthern EuropeSpainSri LankaSt. Vincent and the GrenadinesSudanSwedenSwitzerlandSyriaTaiwanThailandTrinidad and TobagoTurkeyUgandaUkraineUruguayUzbekistanVenezuelaVietnamWest IndiesWestern AfricaWestern AsiaWestern EuropeYemenZaireZimbabweAzores
Thai
Race
Ancestry
AfghanAfricanAlaska NativeAlaskan AthabascanAlbanianAleutAlsatianAmericanApacheArabArapahoArgentineanArmenianAssyrian/Chaldean/SyriacAustralianAustrianBahamianBangladeshiBarbadianBasqueBelgianBelizeanBermudanBhutaneseBlackfeetBolivianBrazilianBritishBritish West IndianBulgarianBurmeseCajunCambodianCanadianCape VerdeanCarpatho RusynCelticCentral AmericanCentral American IndianCherokeeCheyenneChickasawChileanChineseChippewaChoctawColombianColvilleComancheCosta RicanCreeCreekCroatianCrowCubanCypriotCzechCzechoslovakianDanishDelawareDominicanDutchDutch West IndianEastern EuropeanEcuadorianEgyptianEnglishEstonianEthiopianEuropeanFijianFilipinoFinnishFrenchFrench American IndianFrench CanadianGermanGerman RussianGhanaianGreekGuamanian/ChamorroGuatemalanGuyaneseHaitianHmongHonduranHopiHoumaHungarianIcelanderIndian (Asian)IndonesianInupiatIranianIraqiIrishIroquoisIsraeliItalianJamaicanJapaneseJordanianKenyanKiowaKoreanLaotianLatvianLebaneseLiberianLithuanianLumbeeLuxembourgerMacedonianMalaysianMalteseMarshalleseMenomineeMexicanMexican American IndianMongolianMoroccanNative HawaiianNavajoNepaleseNew ZealanderNicaraguanNigerianNorthern EuropeanNorwegianOkinawanOsageOttawaPaiutePakistaniPalestinianPanamanianParaguayanPennsylvania GermanPeruvianPimaPolishPortuguesePotawatomiPuebloPuerto RicanPuget Sound SalishRomanianRussianSalvadoranSamoanScandinavianScotch-IrishScottishSeminoleSenegaleseSerbianShoshoneSierra LeoneanSiouxSlavicSlovakSloveneSomaliSouth AfricanSouth AmericanSouth American IndianSoviet UnionSpaniardSpanishSpanish AmericanSpanish American IndianSri LankanSubsaharan AfricanSudaneseSwedishSwissSyrianTaiwaneseThaiTlingit-HaidaTohono O'OdhamTonganTrinidadian and TobagonianTsimshianTurkishU.S. Virgin IslanderUgandanUkrainianUruguayanUteVenezuelanVietnameseWelshWest IndianYakamaYaquiYugoslavianYumanYup'ikZimbabwean
Immigration
NonimmigrantsImmigrantsAfghanistanAfricaAlbaniaArgentinaArmeniaAsiaAustraliaAustriaBahamasBangladeshBarbadosBelarusBelgiumBelizeBoliviaBosnia and HerzegovinaBrazilBulgariaBurma/MyanmarCabo VerdeCambodiaCameroonCanadaCaribbeanCentral AmericaChileChinaColombiaCongoCosta RicaCroatiaCubaCzechoslovakiaDenmarkDominicaDominican RepublicEastern AfricaEastern AsiaEastern EuropeEcuadorEgyptEl SalvadorEnglandEritreaEthiopiaEuropeFijiFranceGermanyGhanaGreeceGrenadaGuatemalaGuyanaHaitiHondurasHong KongHungaryIndiaIndonesiaIranIraqIrelandIsraelItalyJamaicaJapanJordanKazakhstanKenyaKoreaKuwaitLaosLatin AmericaLatviaLebanonLiberiaLithuaniaMalaysiaMexicoMicronesiaMiddle AfricaMoldovaMoroccoNepalNetherlandsNicaraguaNigeriaNorth AmericaNorth MacedoniaNorthern AfricaNorthern EuropeNorwayOceaniaPakistanPanamaPeruPhilippinesPolandPortugalRomaniaRussiaSaudi ArabiaScotlandSenegalSerbiaSierra LeoneSingaporeSomaliaSouth AfricaSouth AmericaSouth Central AsiaSouth Eastern AsiaSouthern EuropeSpainSri LankaSt. Vincent and the GrenadinesSudanSwedenSwitzerlandSyriaTaiwanThailandTrinidad and TobagoTurkeyUkraineUruguayUzbekistanVenezuelaVietnamWest IndiesWestern AfricaWestern AsiaWestern EuropeYemenZaireZimbabweAzores
Median Family Income
Income
Poverty
Unemployment
Labor Participation
Family Structure
Vehicle Availability
Education Level
Disability

Median Family Income Comparison

Immigrants from Uganda

Thais

Excellent
Exceptional
$106,188
MEDIAN FAMILY INCOME
85.7/ 100
METRIC RATING
137th/ 347
METRIC RANK
$131,281
MEDIAN FAMILY INCOME
100.0/ 100
METRIC RATING
6th/ 347
METRIC RANK

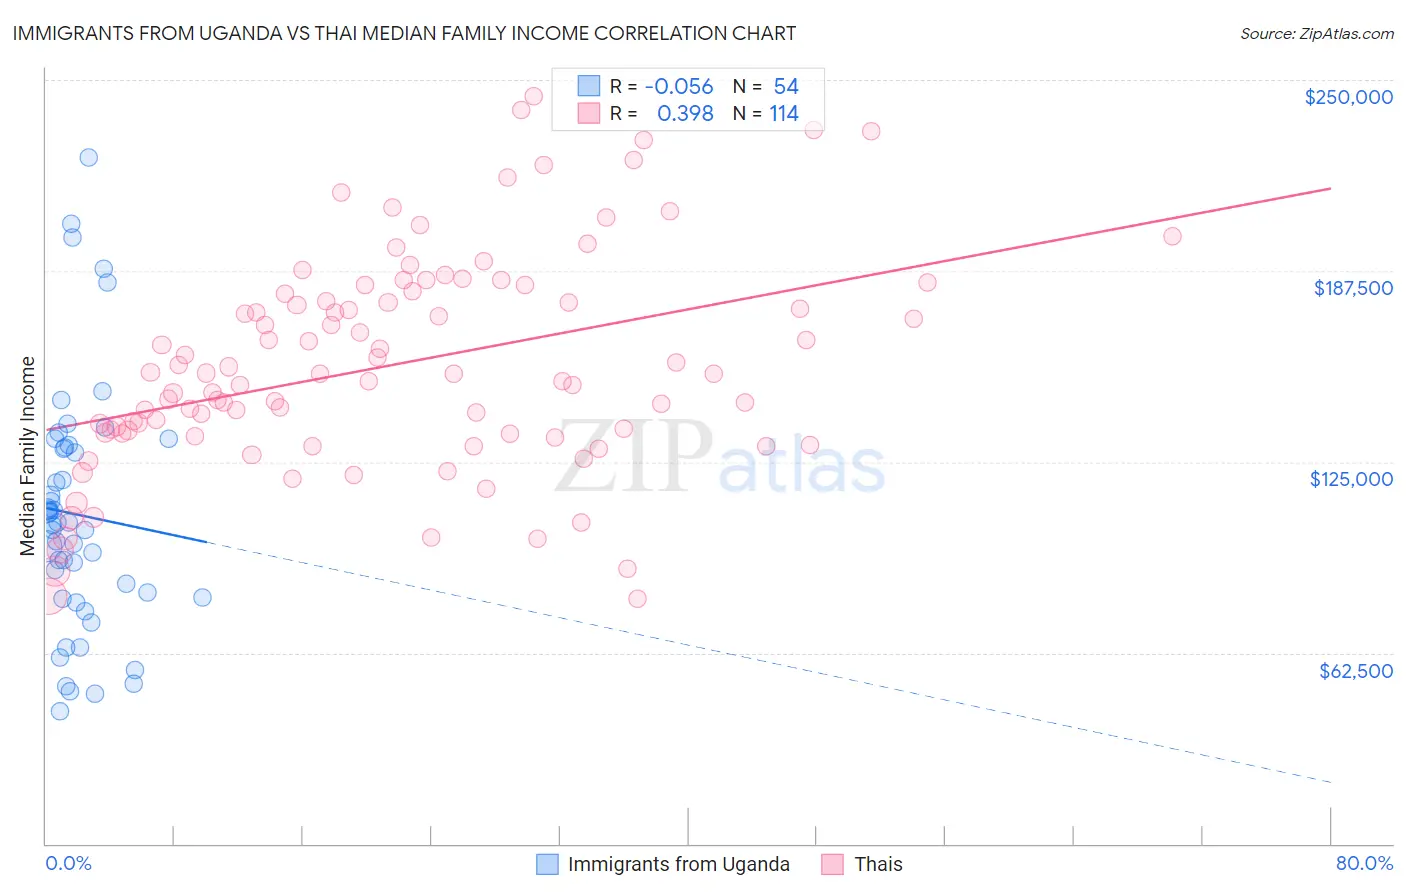
Immigrants from Uganda vs Thai Median Family Income Correlation Chart

The statistical analysis conducted on geographies consisting of 125,960,521 people shows a slight negative correlation between the proportion of Immigrants from Uganda and median family income in the United States with a correlation coefficient (R) of -0.056 and weighted average of $106,188. Similarly, the statistical analysis conducted on geographies consisting of 475,139,998 people shows a mild positive correlation between the proportion of Thais and median family income in the United States with a correlation coefficient (R) of 0.398 and weighted average of $131,281, a difference of 23.6%.
Immigrants from Uganda vs Thai Median Family Income

Median Family Income Correlation Summary

MeasurementImmigrants from UgandaThai
Minimum$43,204$80,156
Maximum$224,567$244,604
Range$181,363$164,448
Mean$107,720$156,697
Median$104,727$153,787
Interquartile 25% (IQ1)$80,714$134,216
Interquartile 75% (IQ3)$129,701$179,995
Interquartile Range (IQR)$48,987$45,779
Standard Deviation (Sample)$40,035$35,454
Standard Deviation (Population)$39,663$35,298

Similar Demographics by Median Family Income

Demographics Similar to Immigrants from Uganda by Median Family Income

In terms of median family income, the demographic groups most similar to Immigrants from Uganda are Immigrants from Vietnam ($106,186, a difference of 0.0%), Luxembourger ($106,183, a difference of 0.0%), Norwegian ($106,144, a difference of 0.040%), Immigrants from South Eastern Asia ($106,252, a difference of 0.060%), and Immigrants from Syria ($106,118, a difference of 0.070%).
DemographicsRating | RankMedian Family Income
Brazilians
89.8
/100
|
#130
Excellent
$106,942
Canadians
88.1
/100
|
#131
Excellent
$106,597
Immigrants | Fiji
87.8
/100
|
#132
Excellent
$106,544
Ugandans
87.8
/100
|
#133
Excellent
$106,541
Immigrants | Oceania
87.3
/100
|
#134
Excellent
$106,453
Portuguese
86.3
/100
|
#135
Excellent
$106,286
Immigrants | South Eastern Asia
86.1
/100
|
#136
Excellent
$106,252
Immigrants | Uganda
85.7
/100
|
#137
Excellent
$106,188
Immigrants | Vietnam
85.7
/100
|
#138
Excellent
$106,186
Luxembourgers
85.7
/100
|
#139
Excellent
$106,183
Norwegians
85.5
/100
|
#140
Excellent
$106,144
Immigrants | Syria
85.3
/100
|
#141
Excellent
$106,118
Slovenes
84.7
/100
|
#142
Excellent
$106,020
Tongans
84.3
/100
|
#143
Excellent
$105,967
Immigrants | Morocco
84.3
/100
|
#144
Excellent
$105,964

Demographics Similar to Thais by Median Family Income

In terms of median family income, the demographic groups most similar to Thais are Immigrants from Hong Kong ($131,067, a difference of 0.16%), Immigrants from Iran ($130,894, a difference of 0.30%), Okinawan ($129,979, a difference of 1.0%), Iranian ($133,839, a difference of 1.9%), and Immigrants from India ($134,028, a difference of 2.1%).
DemographicsRating | RankMedian Family Income
Filipinos
100.0
/100
|
#1
Exceptional
$138,397
Immigrants | Taiwan
100.0
/100
|
#2
Exceptional
$136,949
Immigrants | Singapore
100.0
/100
|
#3
Exceptional
$134,818
Immigrants | India
100.0
/100
|
#4
Exceptional
$134,028
Iranians
100.0
/100
|
#5
Exceptional
$133,839
Thais
100.0
/100
|
#6
Exceptional
$131,281
Immigrants | Hong Kong
100.0
/100
|
#7
Exceptional
$131,067
Immigrants | Iran
100.0
/100
|
#8
Exceptional
$130,894
Okinawans
100.0
/100
|
#9
Exceptional
$129,979
Immigrants | Ireland
100.0
/100
|
#10
Exceptional
$127,584
Immigrants | Israel
100.0
/100
|
#11
Exceptional
$127,430
Cypriots
100.0
/100
|
#12
Exceptional
$127,064
Immigrants | Australia
100.0
/100
|
#13
Exceptional
$126,620
Immigrants | South Central Asia
100.0
/100
|
#14
Exceptional
$125,956
Eastern Europeans
100.0
/100
|
#15
Exceptional
$125,546