Immigrants from Trinidad and Tobago vs Immigrants from Southern Europe Householder Income Ages 25 - 44 years
COMPARE
Immigrants from Trinidad and Tobago
Immigrants from Southern Europe
Householder Income Ages 25 - 44 years
Householder Income Ages 25 - 44 years Comparison
Immigrants from Trinidad and Tobago
Immigrants from Southern Europe
$89,748
HOUSEHOLDER INCOME AGES 25 - 44 YEARS
6.5/ 100
METRIC RATING
221st/ 347
METRIC RANK
$103,486
HOUSEHOLDER INCOME AGES 25 - 44 YEARS
99.3/ 100
METRIC RATING
77th/ 347
METRIC RANK
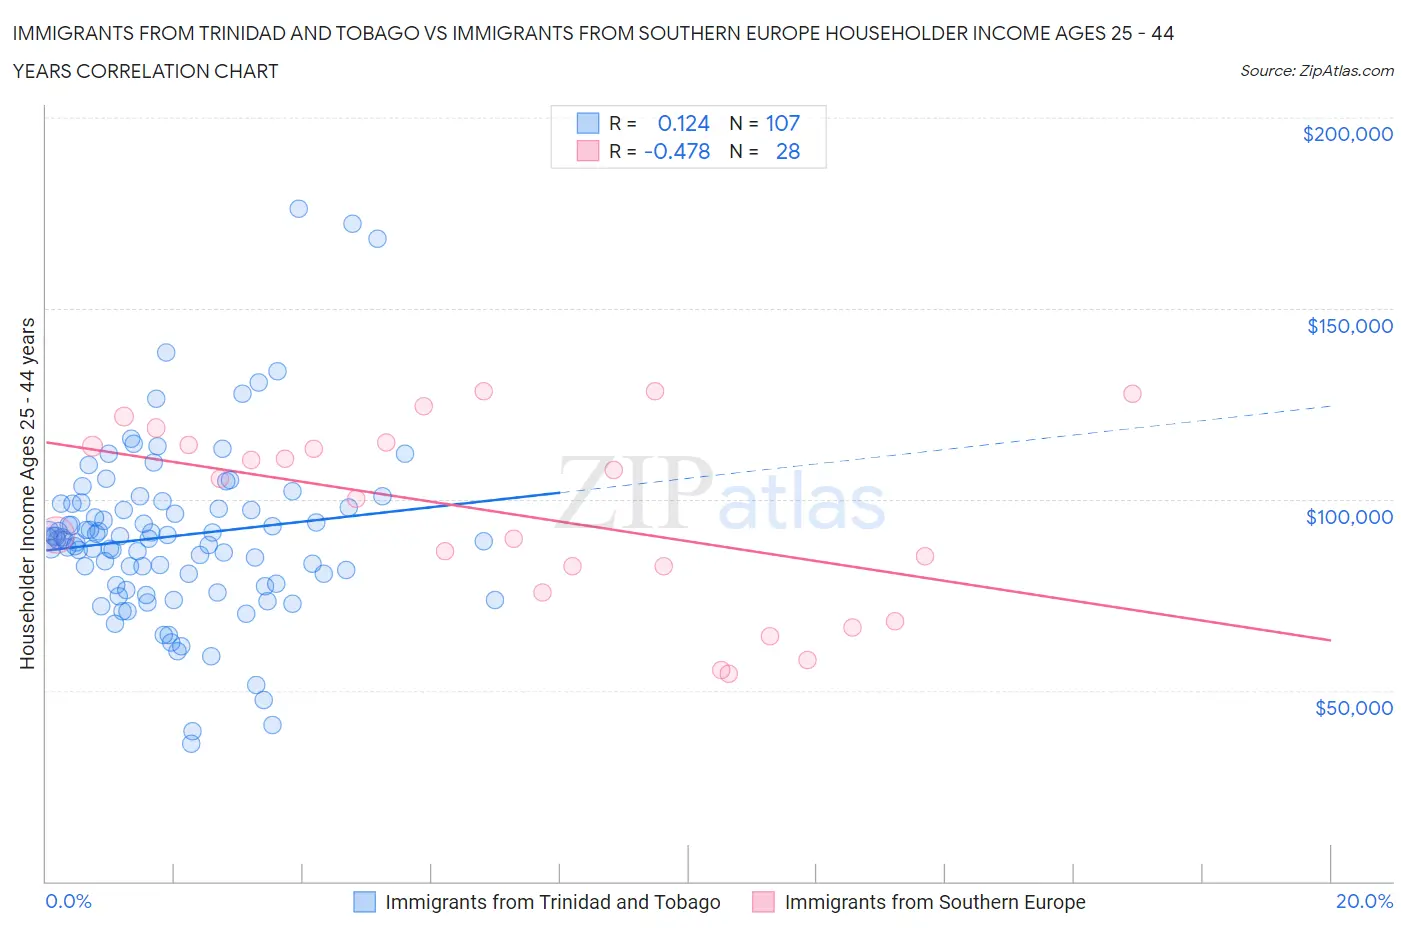
Immigrants from Trinidad and Tobago vs Immigrants from Southern Europe Householder Income Ages 25 - 44 years Correlation Chart
The statistical analysis conducted on geographies consisting of 223,299,534 people shows a poor positive correlation between the proportion of Immigrants from Trinidad and Tobago and household income with householder between the ages 25 and 44 in the United States with a correlation coefficient (R) of 0.124 and weighted average of $89,748. Similarly, the statistical analysis conducted on geographies consisting of 401,612,354 people shows a moderate negative correlation between the proportion of Immigrants from Southern Europe and household income with householder between the ages 25 and 44 in the United States with a correlation coefficient (R) of -0.478 and weighted average of $103,486, a difference of 15.3%.
Householder Income Ages 25 - 44 years Correlation Summary
| Measurement | Immigrants from Trinidad and Tobago | Immigrants from Southern Europe |
| Minimum | $35,919 | $54,315 |
| Maximum | $176,250 | $128,289 |
| Range | $140,331 | $73,974 |
| Mean | $90,423 | $96,371 |
| Median | $89,618 | $102,776 |
| Interquartile 25% (IQ1) | $77,590 | $78,949 |
| Interquartile 75% (IQ3) | $98,814 | $114,674 |
| Interquartile Range (IQR) | $21,224 | $35,724 |
| Standard Deviation (Sample) | $23,047 | $24,047 |
| Standard Deviation (Population) | $22,939 | $23,614 |
Similar Demographics by Householder Income Ages 25 - 44 years
Demographics Similar to Immigrants from Trinidad and Tobago by Householder Income Ages 25 - 44 years
In terms of householder income ages 25 - 44 years, the demographic groups most similar to Immigrants from Trinidad and Tobago are Immigrants from Ecuador ($89,673, a difference of 0.080%), Trinidadian and Tobagonian ($89,856, a difference of 0.12%), Delaware ($89,876, a difference of 0.14%), Immigrants from Guyana ($89,586, a difference of 0.18%), and Barbadian ($89,565, a difference of 0.20%).
| Demographics | Rating | Rank | Householder Income Ages 25 - 44 years |
| Immigrants | Africa | 8.9 /100 | #214 | Tragic $90,372 |
| Panamanians | 8.1 /100 | #215 | Tragic $90,193 |
| Ghanaians | 7.9 /100 | #216 | Tragic $90,137 |
| Scotch-Irish | 7.3 /100 | #217 | Tragic $89,969 |
| Guyanese | 7.1 /100 | #218 | Tragic $89,940 |
| Delaware | 6.9 /100 | #219 | Tragic $89,876 |
| Trinidadians and Tobagonians | 6.8 /100 | #220 | Tragic $89,856 |
| Immigrants | Trinidad and Tobago | 6.5 /100 | #221 | Tragic $89,748 |
| Immigrants | Ecuador | 6.2 /100 | #222 | Tragic $89,673 |
| Immigrants | Guyana | 5.9 /100 | #223 | Tragic $89,586 |
| Barbadians | 5.9 /100 | #224 | Tragic $89,565 |
| Immigrants | Panama | 5.5 /100 | #225 | Tragic $89,451 |
| Immigrants | Iraq | 5.5 /100 | #226 | Tragic $89,444 |
| Immigrants | St. Vincent and the Grenadines | 4.1 /100 | #227 | Tragic $88,888 |
| Immigrants | Bosnia and Herzegovina | 4.0 /100 | #228 | Tragic $88,819 |
Demographics Similar to Immigrants from Southern Europe by Householder Income Ages 25 - 44 years
In terms of householder income ages 25 - 44 years, the demographic groups most similar to Immigrants from Southern Europe are Immigrants from Bulgaria ($103,423, a difference of 0.060%), Armenian ($103,248, a difference of 0.23%), Immigrants from Spain ($103,752, a difference of 0.26%), Immigrants from Egypt ($103,192, a difference of 0.28%), and South African ($103,160, a difference of 0.32%).
| Demographics | Rating | Rank | Householder Income Ages 25 - 44 years |
| Immigrants | Croatia | 99.6 /100 | #70 | Exceptional $104,503 |
| Afghans | 99.6 /100 | #71 | Exceptional $104,410 |
| Chinese | 99.5 /100 | #72 | Exceptional $104,264 |
| Italians | 99.5 /100 | #73 | Exceptional $104,215 |
| Immigrants | Fiji | 99.5 /100 | #74 | Exceptional $103,954 |
| Koreans | 99.4 /100 | #75 | Exceptional $103,824 |
| Immigrants | Spain | 99.4 /100 | #76 | Exceptional $103,752 |
| Immigrants | Southern Europe | 99.3 /100 | #77 | Exceptional $103,486 |
| Immigrants | Bulgaria | 99.3 /100 | #78 | Exceptional $103,423 |
| Armenians | 99.2 /100 | #79 | Exceptional $103,248 |
| Immigrants | Egypt | 99.2 /100 | #80 | Exceptional $103,192 |
| South Africans | 99.2 /100 | #81 | Exceptional $103,160 |
| Immigrants | Serbia | 99.2 /100 | #82 | Exceptional $103,155 |
| Argentineans | 99.1 /100 | #83 | Exceptional $103,111 |
| Immigrants | Philippines | 99.0 /100 | #84 | Exceptional $102,910 |