Immigrants from Sudan vs Immigrants from Uzbekistan Median Earnings
COMPARE
Immigrants from Sudan
Immigrants from Uzbekistan
Median Earnings
Median Earnings Comparison
Immigrants from Sudan
Immigrants from Uzbekistan
$44,767
MEDIAN EARNINGS
8.8/ 100
METRIC RATING
233rd/ 347
METRIC RANK
$50,151
MEDIAN EARNINGS
99.5/ 100
METRIC RATING
87th/ 347
METRIC RANK
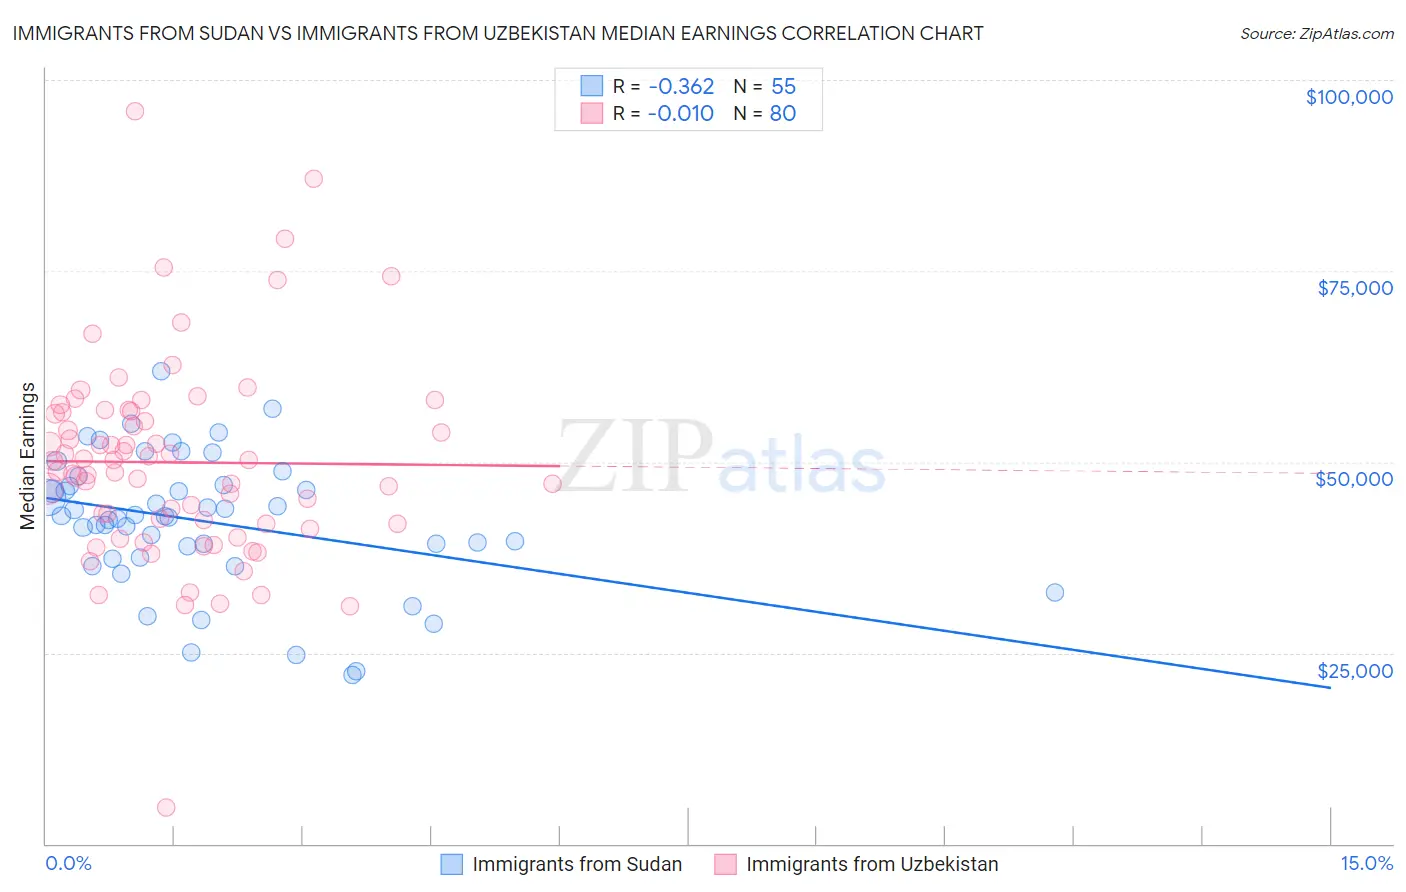
Immigrants from Sudan vs Immigrants from Uzbekistan Median Earnings Correlation Chart
The statistical analysis conducted on geographies consisting of 118,956,438 people shows a mild negative correlation between the proportion of Immigrants from Sudan and median earnings in the United States with a correlation coefficient (R) of -0.362 and weighted average of $44,767. Similarly, the statistical analysis conducted on geographies consisting of 118,764,980 people shows no correlation between the proportion of Immigrants from Uzbekistan and median earnings in the United States with a correlation coefficient (R) of -0.010 and weighted average of $50,151, a difference of 12.0%.
Median Earnings Correlation Summary
| Measurement | Immigrants from Sudan | Immigrants from Uzbekistan |
| Minimum | $22,094 | $4,716 |
| Maximum | $61,886 | $95,833 |
| Range | $39,792 | $91,117 |
| Mean | $42,201 | $49,941 |
| Median | $42,956 | $49,455 |
| Interquartile 25% (IQ1) | $37,545 | $41,888 |
| Interquartile 75% (IQ3) | $47,029 | $56,559 |
| Interquartile Range (IQR) | $9,484 | $14,671 |
| Standard Deviation (Sample) | $8,696 | $13,280 |
| Standard Deviation (Population) | $8,617 | $13,197 |
Similar Demographics by Median Earnings
Demographics Similar to Immigrants from Sudan by Median Earnings
In terms of median earnings, the demographic groups most similar to Immigrants from Sudan are Delaware ($44,783, a difference of 0.040%), Japanese ($44,825, a difference of 0.13%), Immigrants from Western Africa ($44,893, a difference of 0.28%), Cape Verdean ($44,640, a difference of 0.28%), and Scotch-Irish ($44,924, a difference of 0.35%).
| Demographics | Rating | Rank | Median Earnings |
| Immigrants | Nigeria | 12.2 /100 | #226 | Poor $45,030 |
| Native Hawaiians | 12.2 /100 | #227 | Poor $45,027 |
| Immigrants | Iraq | 11.6 /100 | #228 | Poor $44,988 |
| Scotch-Irish | 10.7 /100 | #229 | Poor $44,924 |
| Immigrants | Western Africa | 10.3 /100 | #230 | Poor $44,893 |
| Japanese | 9.5 /100 | #231 | Tragic $44,825 |
| Delaware | 9.0 /100 | #232 | Tragic $44,783 |
| Immigrants | Sudan | 8.8 /100 | #233 | Tragic $44,767 |
| Cape Verdeans | 7.5 /100 | #234 | Tragic $44,640 |
| Venezuelans | 6.9 /100 | #235 | Tragic $44,580 |
| British West Indians | 6.7 /100 | #236 | Tragic $44,552 |
| Immigrants | Ecuador | 5.9 /100 | #237 | Tragic $44,462 |
| Sudanese | 5.6 /100 | #238 | Tragic $44,419 |
| Senegalese | 5.3 /100 | #239 | Tragic $44,373 |
| Aleuts | 4.4 /100 | #240 | Tragic $44,241 |
Demographics Similar to Immigrants from Uzbekistan by Median Earnings
In terms of median earnings, the demographic groups most similar to Immigrants from Uzbekistan are Albanian ($50,116, a difference of 0.070%), Immigrants from Canada ($50,192, a difference of 0.080%), Immigrants from North America ($50,108, a difference of 0.090%), Immigrants from Hungary ($50,227, a difference of 0.15%), and Immigrants from Kazakhstan ($50,225, a difference of 0.15%).
| Demographics | Rating | Rank | Median Earnings |
| Ukrainians | 99.6 /100 | #80 | Exceptional $50,320 |
| Immigrants | Southern Europe | 99.6 /100 | #81 | Exceptional $50,280 |
| Immigrants | Moldova | 99.5 /100 | #82 | Exceptional $50,274 |
| Romanians | 99.5 /100 | #83 | Exceptional $50,244 |
| Immigrants | Hungary | 99.5 /100 | #84 | Exceptional $50,227 |
| Immigrants | Kazakhstan | 99.5 /100 | #85 | Exceptional $50,225 |
| Immigrants | Canada | 99.5 /100 | #86 | Exceptional $50,192 |
| Immigrants | Uzbekistan | 99.5 /100 | #87 | Exceptional $50,151 |
| Albanians | 99.4 /100 | #88 | Exceptional $50,116 |
| Immigrants | North America | 99.4 /100 | #89 | Exceptional $50,108 |
| Italians | 99.3 /100 | #90 | Exceptional $49,915 |
| Macedonians | 99.2 /100 | #91 | Exceptional $49,893 |
| Immigrants | Argentina | 99.2 /100 | #92 | Exceptional $49,841 |
| Armenians | 99.1 /100 | #93 | Exceptional $49,804 |
| Croatians | 99.0 /100 | #94 | Exceptional $49,724 |