Immigrants from South Eastern Asia vs Puget Sound Salish Householder Income Over 65 years
COMPARE
Immigrants from South Eastern Asia
Puget Sound Salish
Householder Income Over 65 years
Householder Income Over 65 years Comparison
Immigrants from South Eastern Asia
Puget Sound Salish
$64,089
HOUSEHOLDER INCOME OVER 65 YEARS
96.3/ 100
METRIC RATING
100th/ 347
METRIC RANK
$59,934
HOUSEHOLDER INCOME OVER 65 YEARS
25.3/ 100
METRIC RATING
190th/ 347
METRIC RANK
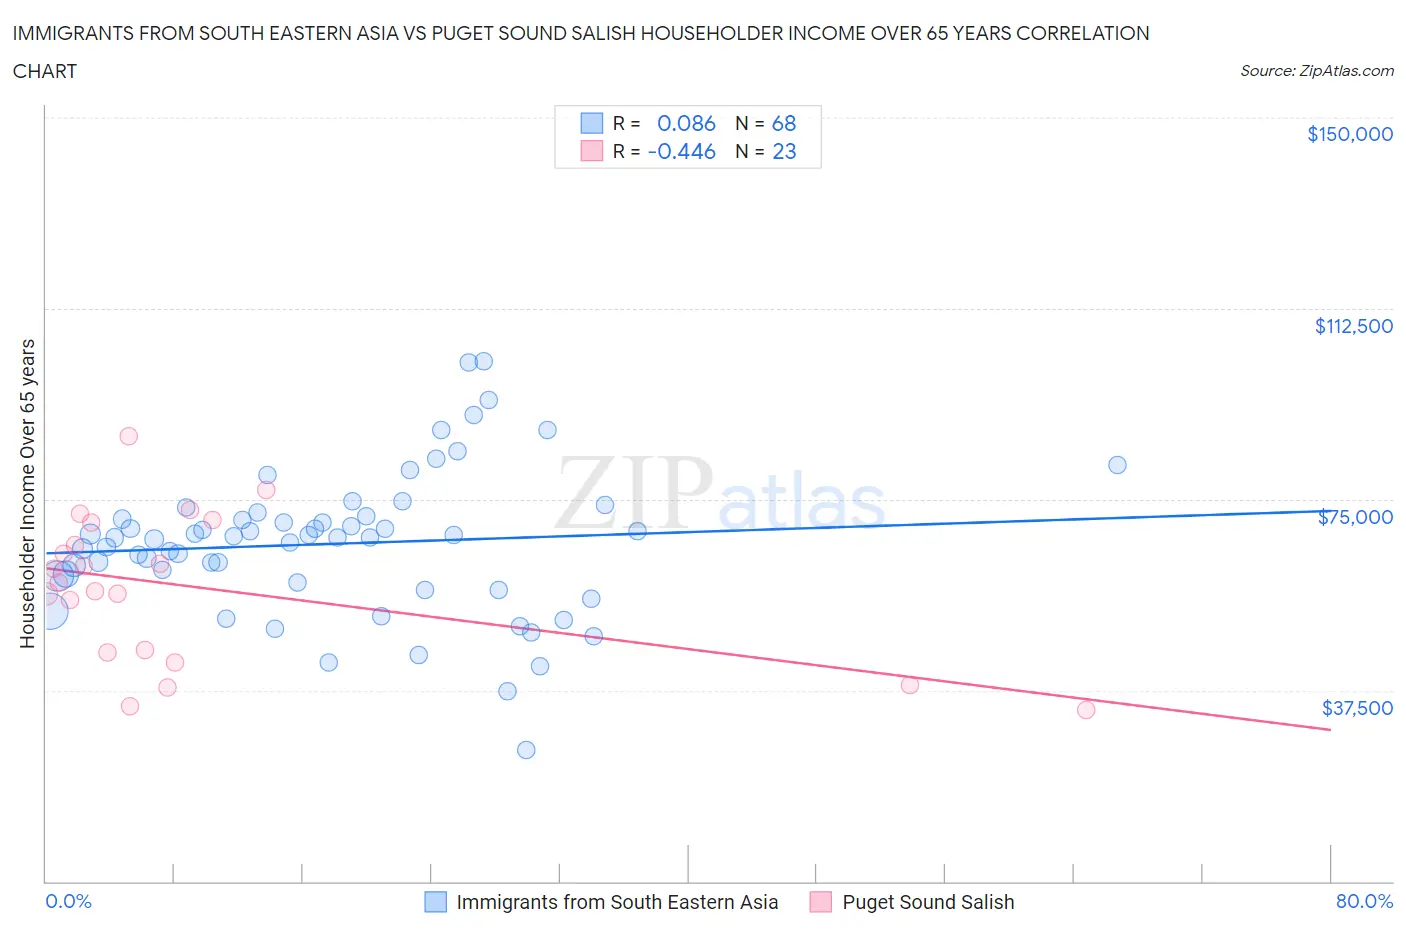
Immigrants from South Eastern Asia vs Puget Sound Salish Householder Income Over 65 years Correlation Chart
The statistical analysis conducted on geographies consisting of 509,707,979 people shows a slight positive correlation between the proportion of Immigrants from South Eastern Asia and household income with householder over the age of 65 in the United States with a correlation coefficient (R) of 0.086 and weighted average of $64,089. Similarly, the statistical analysis conducted on geographies consisting of 46,053,269 people shows a moderate negative correlation between the proportion of Puget Sound Salish and household income with householder over the age of 65 in the United States with a correlation coefficient (R) of -0.446 and weighted average of $59,934, a difference of 6.9%.
Householder Income Over 65 years Correlation Summary
| Measurement | Immigrants from South Eastern Asia | Puget Sound Salish |
| Minimum | $25,692 | $33,750 |
| Maximum | $102,052 | $87,353 |
| Range | $76,360 | $53,603 |
| Mean | $66,259 | $57,757 |
| Median | $67,494 | $58,633 |
| Interquartile 25% (IQ1) | $59,292 | $44,987 |
| Interquartile 75% (IQ3) | $71,386 | $70,359 |
| Interquartile Range (IQR) | $12,094 | $25,372 |
| Standard Deviation (Sample) | $14,078 | $14,442 |
| Standard Deviation (Population) | $13,974 | $14,125 |
Similar Demographics by Householder Income Over 65 years
Demographics Similar to Immigrants from South Eastern Asia by Householder Income Over 65 years
In terms of householder income over 65 years, the demographic groups most similar to Immigrants from South Eastern Asia are Assyrian/Chaldean/Syriac ($64,108, a difference of 0.030%), Immigrants from Italy ($64,065, a difference of 0.040%), Romanian ($64,142, a difference of 0.080%), Sri Lankan ($64,201, a difference of 0.17%), and Chilean ($63,957, a difference of 0.21%).
| Demographics | Rating | Rank | Householder Income Over 65 years |
| Jordanians | 97.1 /100 | #93 | Exceptional $64,313 |
| Immigrants | Egypt | 97.0 /100 | #94 | Exceptional $64,299 |
| Immigrants | Latvia | 97.0 /100 | #95 | Exceptional $64,298 |
| Immigrants | Hungary | 97.0 /100 | #96 | Exceptional $64,277 |
| Sri Lankans | 96.7 /100 | #97 | Exceptional $64,201 |
| Romanians | 96.5 /100 | #98 | Exceptional $64,142 |
| Assyrians/Chaldeans/Syriacs | 96.4 /100 | #99 | Exceptional $64,108 |
| Immigrants | South Eastern Asia | 96.3 /100 | #100 | Exceptional $64,089 |
| Immigrants | Italy | 96.2 /100 | #101 | Exceptional $64,065 |
| Chileans | 95.8 /100 | #102 | Exceptional $63,957 |
| British | 95.7 /100 | #103 | Exceptional $63,940 |
| Immigrants | Cameroon | 95.6 /100 | #104 | Exceptional $63,907 |
| Italians | 95.5 /100 | #105 | Exceptional $63,885 |
| Immigrants | Argentina | 95.5 /100 | #106 | Exceptional $63,885 |
| Pakistanis | 95.3 /100 | #107 | Exceptional $63,844 |
Demographics Similar to Puget Sound Salish by Householder Income Over 65 years
In terms of householder income over 65 years, the demographic groups most similar to Puget Sound Salish are Belgian ($59,915, a difference of 0.030%), South American ($59,854, a difference of 0.13%), Immigrants from Costa Rica ($59,848, a difference of 0.14%), Immigrants from Africa ($59,837, a difference of 0.16%), and Ghanaian ($60,043, a difference of 0.18%).
| Demographics | Rating | Rank | Householder Income Over 65 years |
| Kenyans | 38.4 /100 | #183 | Fair $60,514 |
| Iraqis | 37.2 /100 | #184 | Fair $60,466 |
| Albanians | 32.0 /100 | #185 | Fair $60,249 |
| Slovenes | 31.8 /100 | #186 | Fair $60,241 |
| Immigrants | Thailand | 31.3 /100 | #187 | Fair $60,217 |
| Immigrants | Eritrea | 28.6 /100 | #188 | Fair $60,096 |
| Ghanaians | 27.5 /100 | #189 | Fair $60,043 |
| Puget Sound Salish | 25.3 /100 | #190 | Fair $59,934 |
| Belgians | 24.9 /100 | #191 | Fair $59,915 |
| South Americans | 23.8 /100 | #192 | Fair $59,854 |
| Immigrants | Costa Rica | 23.6 /100 | #193 | Fair $59,848 |
| Immigrants | Africa | 23.4 /100 | #194 | Fair $59,837 |
| Immigrants | Iraq | 23.2 /100 | #195 | Fair $59,824 |
| Germans | 21.5 /100 | #196 | Fair $59,730 |
| Immigrants | Kenya | 21.1 /100 | #197 | Fair $59,710 |