Immigrants from South Central Asia vs Cape Verdean Median Male Earnings
COMPARE
Immigrants from South Central Asia
Cape Verdean
Median Male Earnings
Median Male Earnings Comparison
Immigrants from South Central Asia
Cape Verdeans
$68,960
MEDIAN MALE EARNINGS
100.0/ 100
METRIC RATING
9th/ 347
METRIC RANK
$51,103
MEDIAN MALE EARNINGS
3.5/ 100
METRIC RATING
234th/ 347
METRIC RANK
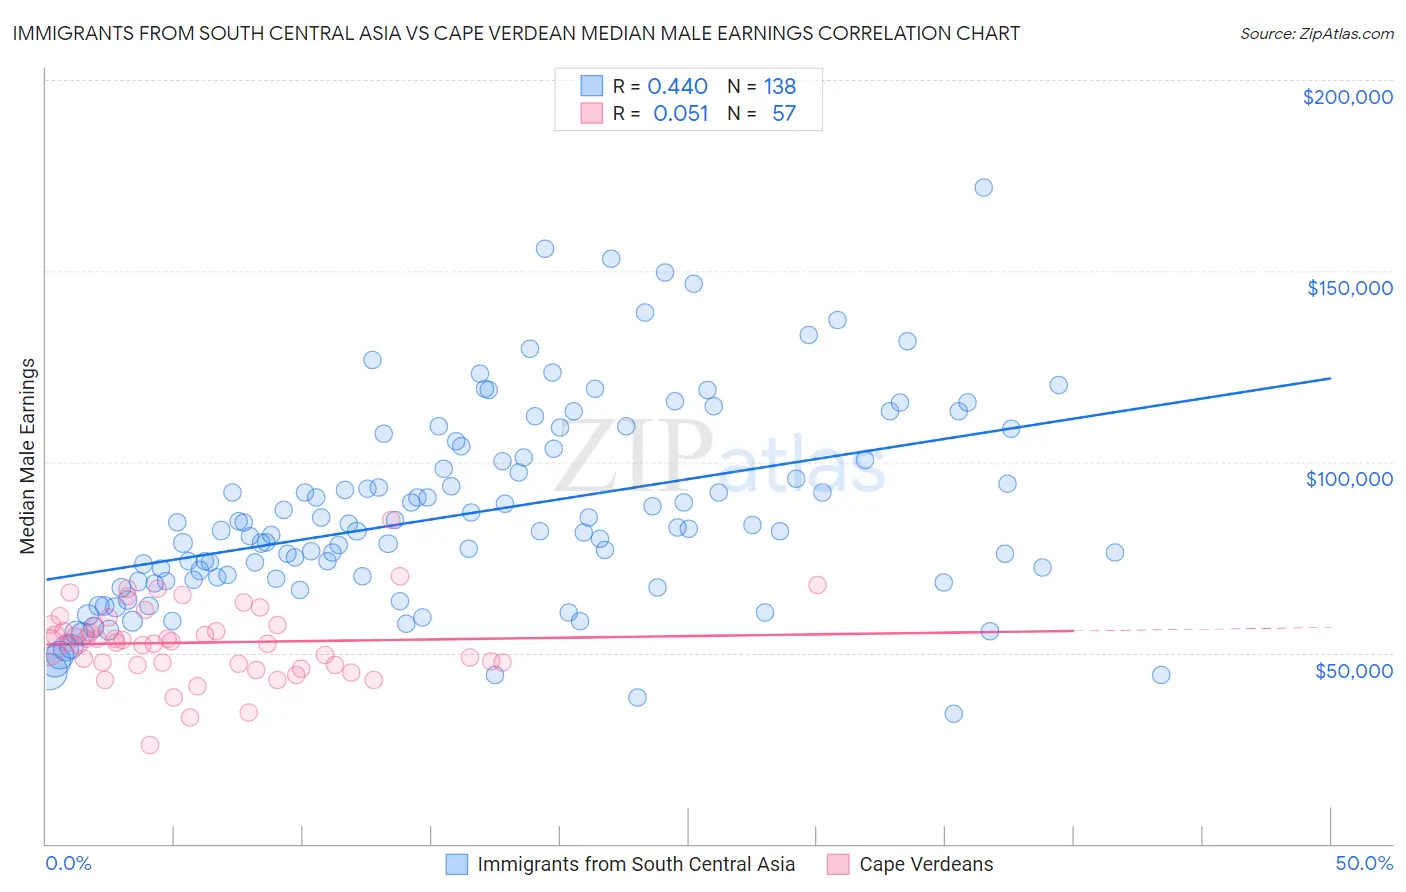
Immigrants from South Central Asia vs Cape Verdean Median Male Earnings Correlation Chart
The statistical analysis conducted on geographies consisting of 472,946,789 people shows a moderate positive correlation between the proportion of Immigrants from South Central Asia and median male earnings in the United States with a correlation coefficient (R) of 0.440 and weighted average of $68,960. Similarly, the statistical analysis conducted on geographies consisting of 107,567,026 people shows a slight positive correlation between the proportion of Cape Verdeans and median male earnings in the United States with a correlation coefficient (R) of 0.051 and weighted average of $51,103, a difference of 34.9%.
Median Male Earnings Correlation Summary
| Measurement | Immigrants from South Central Asia | Cape Verdean |
| Minimum | $34,167 | $25,819 |
| Maximum | $171,875 | $84,702 |
| Range | $137,708 | $58,883 |
| Mean | $86,430 | $52,707 |
| Median | $81,870 | $52,842 |
| Interquartile 25% (IQ1) | $68,829 | $47,020 |
| Interquartile 75% (IQ3) | $101,052 | $57,300 |
| Interquartile Range (IQR) | $32,223 | $10,280 |
| Standard Deviation (Sample) | $26,034 | $9,854 |
| Standard Deviation (Population) | $25,940 | $9,767 |
Similar Demographics by Median Male Earnings
Demographics Similar to Immigrants from South Central Asia by Median Male Earnings
In terms of median male earnings, the demographic groups most similar to Immigrants from South Central Asia are Immigrants from Israel ($68,716, a difference of 0.35%), Immigrants from Iran ($69,284, a difference of 0.47%), Immigrants from Hong Kong ($70,146, a difference of 1.7%), Immigrants from Ireland ($67,698, a difference of 1.9%), and Immigrants from Australia ($67,634, a difference of 2.0%).
| Demographics | Rating | Rank | Median Male Earnings |
| Immigrants | India | 100.0 /100 | #2 | Exceptional $74,207 |
| Immigrants | Taiwan | 100.0 /100 | #3 | Exceptional $74,031 |
| Thais | 100.0 /100 | #4 | Exceptional $72,135 |
| Immigrants | Singapore | 100.0 /100 | #5 | Exceptional $71,348 |
| Iranians | 100.0 /100 | #6 | Exceptional $70,648 |
| Immigrants | Hong Kong | 100.0 /100 | #7 | Exceptional $70,146 |
| Immigrants | Iran | 100.0 /100 | #8 | Exceptional $69,284 |
| Immigrants | South Central Asia | 100.0 /100 | #9 | Exceptional $68,960 |
| Immigrants | Israel | 100.0 /100 | #10 | Exceptional $68,716 |
| Immigrants | Ireland | 100.0 /100 | #11 | Exceptional $67,698 |
| Immigrants | Australia | 100.0 /100 | #12 | Exceptional $67,634 |
| Immigrants | China | 100.0 /100 | #13 | Exceptional $67,353 |
| Okinawans | 100.0 /100 | #14 | Exceptional $67,232 |
| Immigrants | Eastern Asia | 100.0 /100 | #15 | Exceptional $66,903 |
| Eastern Europeans | 100.0 /100 | #16 | Exceptional $66,472 |
Demographics Similar to Cape Verdeans by Median Male Earnings
In terms of median male earnings, the demographic groups most similar to Cape Verdeans are Aleut ($51,168, a difference of 0.13%), Sudanese ($51,216, a difference of 0.22%), Barbadian ($51,236, a difference of 0.26%), Immigrants from Western Africa ($50,940, a difference of 0.32%), and Immigrants from Nigeria ($51,310, a difference of 0.40%).
| Demographics | Rating | Rank | Median Male Earnings |
| Trinidadians and Tobagonians | 4.8 /100 | #227 | Tragic $51,446 |
| Samoans | 4.6 /100 | #228 | Tragic $51,389 |
| Immigrants | Trinidad and Tobago | 4.5 /100 | #229 | Tragic $51,376 |
| Immigrants | Nigeria | 4.2 /100 | #230 | Tragic $51,310 |
| Barbadians | 3.9 /100 | #231 | Tragic $51,236 |
| Sudanese | 3.9 /100 | #232 | Tragic $51,216 |
| Aleuts | 3.7 /100 | #233 | Tragic $51,168 |
| Cape Verdeans | 3.5 /100 | #234 | Tragic $51,103 |
| Immigrants | Western Africa | 3.0 /100 | #235 | Tragic $50,940 |
| Pennsylvania Germans | 2.8 /100 | #236 | Tragic $50,878 |
| Immigrants | Barbados | 2.6 /100 | #237 | Tragic $50,795 |
| Malaysians | 2.5 /100 | #238 | Tragic $50,772 |
| Americans | 2.5 /100 | #239 | Tragic $50,761 |
| West Indians | 2.3 /100 | #240 | Tragic $50,682 |
| Immigrants | St. Vincent and the Grenadines | 2.3 /100 | #241 | Tragic $50,665 |