Immigrants from South America vs Immigrants from Syria Median Household Income

COMPARE

Immigrants from South America
Race
Ancestry
AfghanAfricanAlaska NativeAlaskan AthabascanAlbanianAleutAlsatianAmericanApacheArabArapahoArgentineanArmenianAssyrian/Chaldean/SyriacAustralianAustrianBahamianBangladeshiBarbadianBasqueBelgianBelizeanBermudanBhutaneseBlackfeetBolivianBrazilianBritishBritish West IndianBulgarianBurmeseCajunCambodianCanadianCape VerdeanCarpatho RusynCelticCentral AmericanCentral American IndianCherokeeCheyenneChickasawChileanChineseChippewaChoctawColombianColvilleComancheCosta RicanCreeCreekCroatianCrowCubanCypriotCzechCzechoslovakianDanishDelawareDominicanDutchDutch West IndianEastern EuropeanEcuadorianEgyptianEnglishEstonianEthiopianEuropeanFijianFilipinoFinnishFrenchFrench American IndianFrench CanadianGermanGerman RussianGhanaianGreekGuamanian/ChamorroGuatemalanGuyaneseHaitianHmongHonduranHopiHoumaHungarianIcelanderIndian (Asian)IndonesianInupiatIranianIraqiIrishIroquoisIsraeliItalianJamaicanJapaneseJordanianKenyanKiowaKoreanLaotianLatvianLebaneseLiberianLithuanianLumbeeLuxembourgerMacedonianMalaysianMalteseMarshalleseMenomineeMexicanMexican American IndianMongolianMoroccanNative HawaiianNavajoNepaleseNew ZealanderNicaraguanNigerianNorthern EuropeanNorwegianOkinawanOsageOttawaPaiutePakistaniPalestinianPanamanianParaguayanPennsylvania GermanPeruvianPimaPolishPortuguesePotawatomiPuebloPuerto RicanPuget Sound SalishRomanianRussianSalvadoranSamoanScandinavianScotch-IrishScottishSeminoleSenegaleseSerbianShoshoneSierra LeoneanSiouxSlavicSlovakSloveneSomaliSouth AfricanSouth AmericanSouth American IndianSoviet UnionSpaniardSpanishSpanish AmericanSpanish American IndianSri LankanSubsaharan AfricanSudaneseSwedishSwissSyrianTaiwaneseThaiTlingit-HaidaTohono O'OdhamTonganTrinidadian and TobagonianTsimshianTurkishU.S. Virgin IslanderUgandanUkrainianUruguayanUteVenezuelanVietnameseWelshWest IndianYakamaYaquiYugoslavianYumanYup'ikZimbabwean
Immigration
NonimmigrantsImmigrantsAfghanistanAfricaAlbaniaArgentinaArmeniaAsiaAustraliaAustriaBahamasBangladeshBarbadosBelarusBelgiumBelizeBoliviaBosnia and HerzegovinaBrazilBulgariaBurma/MyanmarCabo VerdeCambodiaCameroonCanadaCaribbeanCentral AmericaChileChinaColombiaCongoCosta RicaCroatiaCubaCzechoslovakiaDenmarkDominicaDominican RepublicEastern AfricaEastern AsiaEastern EuropeEcuadorEgyptEl SalvadorEnglandEritreaEthiopiaEuropeFijiFranceGermanyGhanaGreeceGrenadaGuatemalaGuyanaHaitiHondurasHong KongHungaryIndiaIndonesiaIranIraqIrelandIsraelItalyJamaicaJapanJordanKazakhstanKenyaKoreaKuwaitLaosLatin AmericaLatviaLebanonLiberiaLithuaniaMalaysiaMexicoMicronesiaMiddle AfricaMoldovaMoroccoNepalNetherlandsNicaraguaNigeriaNorth AmericaNorth MacedoniaNorthern AfricaNorthern EuropeNorwayOceaniaPakistanPanamaPeruPhilippinesPolandPortugalRomaniaRussiaSaudi ArabiaScotlandSenegalSerbiaSierra LeoneSingaporeSomaliaSouth AfricaSouth AmericaSouth Central AsiaSouth Eastern AsiaSouthern EuropeSpainSri LankaSt. Vincent and the GrenadinesSudanSwedenSwitzerlandTaiwanThailandTrinidad and TobagoTurkeyUgandaUkraineUruguayUzbekistanVenezuelaVietnamWest IndiesWestern AfricaWestern AsiaWestern EuropeYemenZaireZimbabweAzores
Immigrants from Syria
Race
Ancestry
AfghanAfricanAlaska NativeAlaskan AthabascanAlbanianAleutAlsatianAmericanApacheArabArapahoArgentineanArmenianAssyrian/Chaldean/SyriacAustralianAustrianBahamianBangladeshiBarbadianBasqueBelgianBelizeanBermudanBhutaneseBlackfeetBolivianBrazilianBritishBritish West IndianBulgarianBurmeseCajunCambodianCanadianCape VerdeanCarpatho RusynCelticCentral AmericanCentral American IndianCherokeeCheyenneChickasawChileanChineseChippewaChoctawColombianColvilleComancheCosta RicanCreeCreekCroatianCrowCubanCypriotCzechCzechoslovakianDanishDelawareDominicanDutchDutch West IndianEastern EuropeanEcuadorianEgyptianEnglishEstonianEthiopianEuropeanFijianFilipinoFinnishFrenchFrench American IndianFrench CanadianGermanGerman RussianGhanaianGreekGuamanian/ChamorroGuatemalanGuyaneseHaitianHmongHonduranHopiHoumaHungarianIcelanderIndian (Asian)IndonesianInupiatIranianIraqiIrishIroquoisIsraeliItalianJamaicanJapaneseJordanianKenyanKiowaKoreanLaotianLatvianLebaneseLiberianLithuanianLumbeeLuxembourgerMacedonianMalaysianMalteseMarshalleseMenomineeMexicanMexican American IndianMongolianMoroccanNative HawaiianNavajoNepaleseNew ZealanderNicaraguanNigerianNorthern EuropeanNorwegianOkinawanOsageOttawaPaiutePakistaniPalestinianPanamanianParaguayanPennsylvania GermanPeruvianPimaPolishPortuguesePotawatomiPuebloPuerto RicanPuget Sound SalishRomanianRussianSalvadoranSamoanScandinavianScotch-IrishScottishSeminoleSenegaleseSerbianShoshoneSierra LeoneanSiouxSlavicSlovakSloveneSomaliSouth AfricanSouth AmericanSouth American IndianSoviet UnionSpaniardSpanishSpanish AmericanSpanish American IndianSri LankanSubsaharan AfricanSudaneseSwedishSwissSyrianTaiwaneseThaiTlingit-HaidaTohono O'OdhamTonganTrinidadian and TobagonianTsimshianTurkishU.S. Virgin IslanderUgandanUkrainianUruguayanUteVenezuelanVietnameseWelshWest IndianYakamaYaquiYugoslavianYumanYup'ikZimbabwean
Immigration
NonimmigrantsImmigrantsAfghanistanAfricaAlbaniaArgentinaArmeniaAsiaAustraliaAustriaBahamasBangladeshBarbadosBelarusBelgiumBelizeBoliviaBosnia and HerzegovinaBrazilBulgariaBurma/MyanmarCabo VerdeCambodiaCameroonCanadaCaribbeanCentral AmericaChileChinaColombiaCongoCosta RicaCroatiaCubaCzechoslovakiaDenmarkDominicaDominican RepublicEastern AfricaEastern AsiaEastern EuropeEcuadorEgyptEl SalvadorEnglandEritreaEthiopiaEuropeFijiFranceGermanyGhanaGreeceGrenadaGuatemalaGuyanaHaitiHondurasHong KongHungaryIndiaIndonesiaIranIraqIrelandIsraelItalyJamaicaJapanJordanKazakhstanKenyaKoreaKuwaitLaosLatin AmericaLatviaLebanonLiberiaLithuaniaMalaysiaMexicoMicronesiaMiddle AfricaMoldovaMoroccoNepalNetherlandsNicaraguaNigeriaNorth AmericaNorth MacedoniaNorthern AfricaNorthern EuropeNorwayOceaniaPakistanPanamaPeruPhilippinesPolandPortugalRomaniaRussiaSaudi ArabiaScotlandSenegalSerbiaSierra LeoneSingaporeSomaliaSouth AfricaSouth Central AsiaSouth Eastern AsiaSouthern EuropeSpainSri LankaSt. Vincent and the GrenadinesSudanSwedenSwitzerlandSyriaTaiwanThailandTrinidad and TobagoTurkeyUgandaUkraineUruguayUzbekistanVenezuelaVietnamWest IndiesWestern AfricaWestern AsiaWestern EuropeYemenZaireZimbabweAzores
Median Household Income
Income
Poverty
Unemployment
Labor Participation
Family Structure
Vehicle Availability
Education Level
Disability

Median Household Income Comparison

Immigrants from South America

Immigrants from Syria

Average
Exceptional
$85,611
MEDIAN HOUSEHOLD INCOME
58.1/ 100
METRIC RATING
171st/ 347
METRIC RANK
$88,792
MEDIAN HOUSEHOLD INCOME
91.4/ 100
METRIC RATING
131st/ 347
METRIC RANK

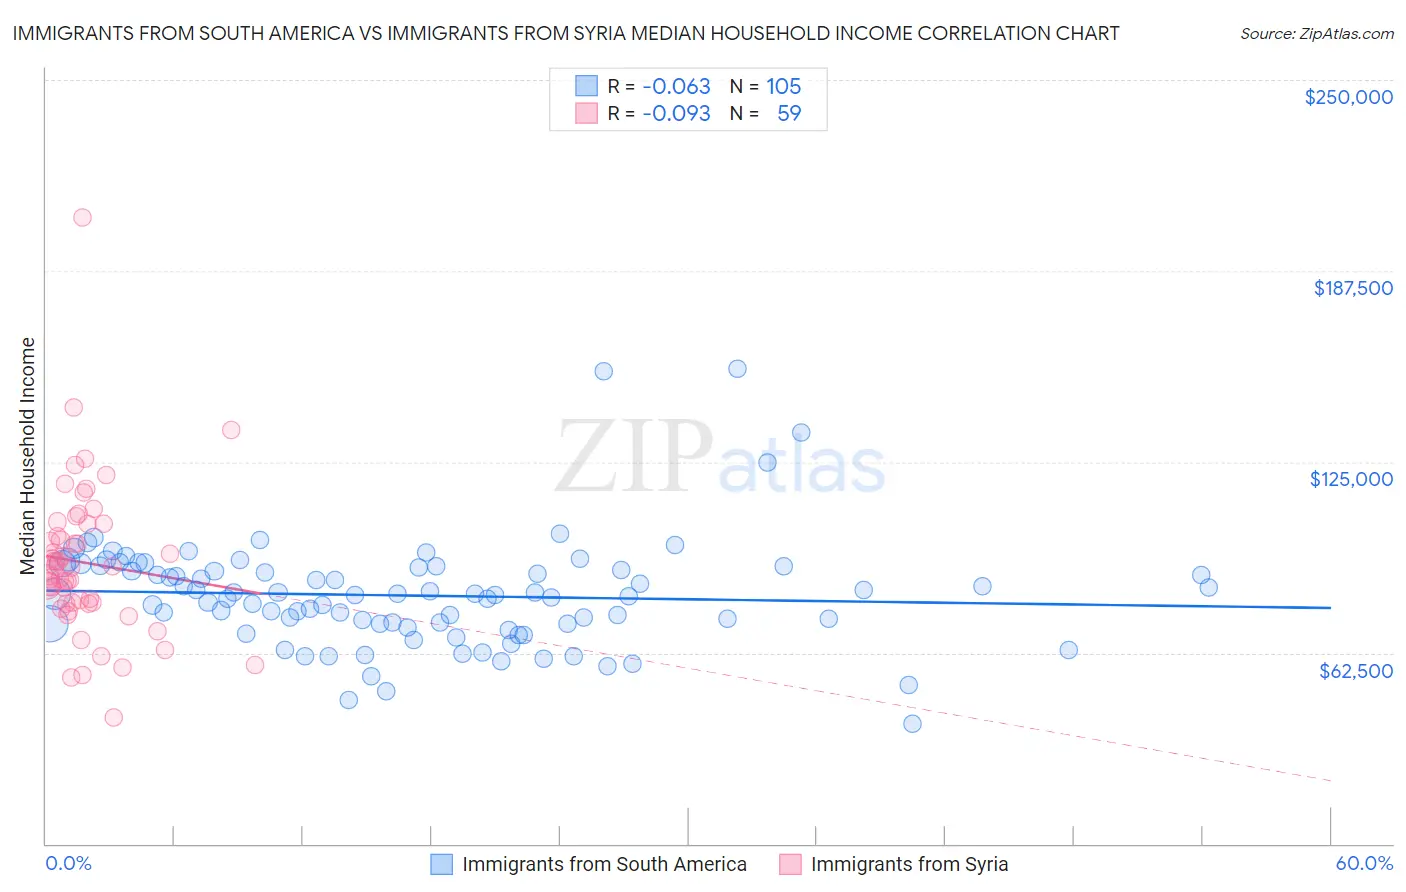
Immigrants from South America vs Immigrants from Syria Median Household Income Correlation Chart

The statistical analysis conducted on geographies consisting of 485,852,946 people shows a slight negative correlation between the proportion of Immigrants from South America and median household income in the United States with a correlation coefficient (R) of -0.063 and weighted average of $85,611. Similarly, the statistical analysis conducted on geographies consisting of 174,102,595 people shows a slight negative correlation between the proportion of Immigrants from Syria and median household income in the United States with a correlation coefficient (R) of -0.093 and weighted average of $88,792, a difference of 3.7%.
Immigrants from South America vs Immigrants from Syria Median Household Income

Median Household Income Correlation Summary

MeasurementImmigrants from South AmericaImmigrants from Syria
Minimum$39,375$41,250
Maximum$155,583$204,875
Range$116,208$163,625
Mean$81,259$92,001
Median$81,529$90,604
Interquartile 25% (IQ1)$71,899$78,558
Interquartile 75% (IQ3)$90,608$104,604
Interquartile Range (IQR)$18,709$26,046
Standard Deviation (Sample)$17,852$25,121
Standard Deviation (Population)$17,766$24,907

Similar Demographics by Median Household Income

Demographics Similar to Immigrants from South America by Median Household Income

In terms of median household income, the demographic groups most similar to Immigrants from South America are Slovene ($85,562, a difference of 0.060%), Swiss ($85,681, a difference of 0.080%), Colombian ($85,716, a difference of 0.12%), Icelander ($85,797, a difference of 0.22%), and Immigrants ($85,818, a difference of 0.24%).
DemographicsRating | RankMedian Household Income
Irish
66.2
/100
|
#164
Good
$86,145
Norwegians
65.3
/100
|
#165
Good
$86,084
Scandinavians
65.1
/100
|
#166
Good
$86,073
Immigrants | Immigrants
61.3
/100
|
#167
Good
$85,818
Icelanders
61.0
/100
|
#168
Good
$85,797
Colombians
59.7
/100
|
#169
Average
$85,716
Swiss
59.2
/100
|
#170
Average
$85,681
Immigrants | South America
58.1
/100
|
#171
Average
$85,611
Slovenes
57.4
/100
|
#172
Average
$85,562
Immigrants | Cameroon
53.4
/100
|
#173
Average
$85,314
Scottish
50.0
/100
|
#174
Average
$85,101
Immigrants | Costa Rica
49.2
/100
|
#175
Average
$85,054
Alsatians
49.2
/100
|
#176
Average
$85,053
Immigrants | Eritrea
48.8
/100
|
#177
Average
$85,025
Czechoslovakians
47.8
/100
|
#178
Average
$84,965

Demographics Similar to Immigrants from Syria by Median Household Income

In terms of median household income, the demographic groups most similar to Immigrants from Syria are European ($88,751, a difference of 0.050%), Immigrants from Ethiopia ($88,687, a difference of 0.12%), British ($88,914, a difference of 0.14%), Brazilian ($88,934, a difference of 0.16%), and Portuguese ($88,976, a difference of 0.21%).
DemographicsRating | RankMedian Household Income
Immigrants | Jordan
94.1
/100
|
#124
Exceptional
$89,412
Immigrants | Kuwait
93.5
/100
|
#125
Exceptional
$89,263
Immigrants | Oceania
92.9
/100
|
#126
Exceptional
$89,100
Immigrants | Peru
92.5
/100
|
#127
Exceptional
$89,010
Portuguese
92.3
/100
|
#128
Exceptional
$88,976
Brazilians
92.1
/100
|
#129
Exceptional
$88,934
British
92.0
/100
|
#130
Exceptional
$88,914
Immigrants | Syria
91.4
/100
|
#131
Exceptional
$88,792
Europeans
91.2
/100
|
#132
Exceptional
$88,751
Immigrants | Ethiopia
90.9
/100
|
#133
Exceptional
$88,687
Swedes
90.0
/100
|
#134
Exceptional
$88,524
Immigrants | Sierra Leone
89.9
/100
|
#135
Excellent
$88,498
Poles
89.7
/100
|
#136
Excellent
$88,472
Sierra Leoneans
89.6
/100
|
#137
Excellent
$88,463
Arabs
89.2
/100
|
#138
Excellent
$88,398