Immigrants from South America vs Immigrants from Egypt Householder Income Ages 45 - 64 years

COMPARE

Immigrants from South America
Race
Ancestry
AfghanAfricanAlaska NativeAlaskan AthabascanAlbanianAleutAlsatianAmericanApacheArabArapahoArgentineanArmenianAssyrian/Chaldean/SyriacAustralianAustrianBahamianBangladeshiBarbadianBasqueBelgianBelizeanBermudanBhutaneseBlackfeetBolivianBrazilianBritishBritish West IndianBulgarianBurmeseCajunCambodianCanadianCape VerdeanCarpatho RusynCelticCentral AmericanCentral American IndianCherokeeCheyenneChickasawChileanChineseChippewaChoctawColombianColvilleComancheCosta RicanCreeCreekCroatianCrowCubanCypriotCzechCzechoslovakianDanishDelawareDominicanDutchDutch West IndianEastern EuropeanEcuadorianEgyptianEnglishEstonianEthiopianEuropeanFijianFilipinoFinnishFrenchFrench American IndianFrench CanadianGermanGerman RussianGhanaianGreekGuamanian/ChamorroGuatemalanGuyaneseHaitianHmongHonduranHopiHoumaHungarianIcelanderIndian (Asian)IndonesianInupiatIranianIraqiIrishIroquoisIsraeliItalianJamaicanJapaneseJordanianKenyanKiowaKoreanLaotianLatvianLebaneseLiberianLithuanianLumbeeLuxembourgerMacedonianMalaysianMalteseMarshalleseMenomineeMexicanMexican American IndianMongolianMoroccanNative HawaiianNavajoNepaleseNew ZealanderNicaraguanNigerianNorthern EuropeanNorwegianOkinawanOsageOttawaPaiutePakistaniPalestinianPanamanianParaguayanPennsylvania GermanPeruvianPimaPolishPortuguesePotawatomiPuebloPuerto RicanPuget Sound SalishRomanianRussianSalvadoranSamoanScandinavianScotch-IrishScottishSeminoleSenegaleseSerbianShoshoneSierra LeoneanSiouxSlavicSlovakSloveneSomaliSouth AfricanSouth AmericanSouth American IndianSoviet UnionSpaniardSpanishSpanish AmericanSpanish American IndianSri LankanSubsaharan AfricanSudaneseSwedishSwissSyrianTaiwaneseThaiTlingit-HaidaTohono O'OdhamTonganTrinidadian and TobagonianTsimshianTurkishU.S. Virgin IslanderUgandanUkrainianUruguayanUteVenezuelanVietnameseWelshWest IndianYakamaYaquiYugoslavianYumanYup'ikZimbabwean
Immigration
NonimmigrantsImmigrantsAfghanistanAfricaAlbaniaArgentinaArmeniaAsiaAustraliaAustriaBahamasBangladeshBarbadosBelarusBelgiumBelizeBoliviaBosnia and HerzegovinaBrazilBulgariaBurma/MyanmarCabo VerdeCambodiaCameroonCanadaCaribbeanCentral AmericaChileChinaColombiaCongoCosta RicaCroatiaCubaCzechoslovakiaDenmarkDominicaDominican RepublicEastern AfricaEastern AsiaEastern EuropeEcuadorEl SalvadorEnglandEritreaEthiopiaEuropeFijiFranceGermanyGhanaGreeceGrenadaGuatemalaGuyanaHaitiHondurasHong KongHungaryIndiaIndonesiaIranIraqIrelandIsraelItalyJamaicaJapanJordanKazakhstanKenyaKoreaKuwaitLaosLatin AmericaLatviaLebanonLiberiaLithuaniaMalaysiaMexicoMicronesiaMiddle AfricaMoldovaMoroccoNepalNetherlandsNicaraguaNigeriaNorth AmericaNorth MacedoniaNorthern AfricaNorthern EuropeNorwayOceaniaPakistanPanamaPeruPhilippinesPolandPortugalRomaniaRussiaSaudi ArabiaScotlandSenegalSerbiaSierra LeoneSingaporeSomaliaSouth AfricaSouth AmericaSouth Central AsiaSouth Eastern AsiaSouthern EuropeSpainSri LankaSt. Vincent and the GrenadinesSudanSwedenSwitzerlandSyriaTaiwanThailandTrinidad and TobagoTurkeyUgandaUkraineUruguayUzbekistanVenezuelaVietnamWest IndiesWestern AfricaWestern AsiaWestern EuropeYemenZaireZimbabweAzores
Immigrants from Egypt
Race
Ancestry
AfghanAfricanAlaska NativeAlaskan AthabascanAlbanianAleutAlsatianAmericanApacheArabArapahoArgentineanArmenianAssyrian/Chaldean/SyriacAustralianAustrianBahamianBangladeshiBarbadianBasqueBelgianBelizeanBermudanBhutaneseBlackfeetBolivianBrazilianBritishBritish West IndianBulgarianBurmeseCajunCambodianCanadianCape VerdeanCarpatho RusynCelticCentral AmericanCentral American IndianCherokeeCheyenneChickasawChileanChineseChippewaChoctawColombianColvilleComancheCosta RicanCreeCreekCroatianCrowCubanCypriotCzechCzechoslovakianDanishDelawareDominicanDutchDutch West IndianEastern EuropeanEcuadorianEgyptianEnglishEstonianEthiopianEuropeanFijianFilipinoFinnishFrenchFrench American IndianFrench CanadianGermanGerman RussianGhanaianGreekGuamanian/ChamorroGuatemalanGuyaneseHaitianHmongHonduranHopiHoumaHungarianIcelanderIndian (Asian)IndonesianInupiatIranianIraqiIrishIroquoisIsraeliItalianJamaicanJapaneseJordanianKenyanKiowaKoreanLaotianLatvianLebaneseLiberianLithuanianLumbeeLuxembourgerMacedonianMalaysianMalteseMarshalleseMenomineeMexicanMexican American IndianMongolianMoroccanNative HawaiianNavajoNepaleseNew ZealanderNicaraguanNigerianNorthern EuropeanNorwegianOkinawanOsageOttawaPaiutePakistaniPalestinianPanamanianParaguayanPennsylvania GermanPeruvianPimaPolishPortuguesePotawatomiPuebloPuerto RicanPuget Sound SalishRomanianRussianSalvadoranSamoanScandinavianScotch-IrishScottishSeminoleSenegaleseSerbianShoshoneSierra LeoneanSiouxSlavicSlovakSloveneSomaliSouth AfricanSouth AmericanSouth American IndianSoviet UnionSpaniardSpanishSpanish AmericanSpanish American IndianSri LankanSubsaharan AfricanSudaneseSwedishSwissSyrianTaiwaneseThaiTlingit-HaidaTohono O'OdhamTonganTrinidadian and TobagonianTsimshianTurkishU.S. Virgin IslanderUgandanUkrainianUruguayanUteVenezuelanVietnameseWelshWest IndianYakamaYaquiYugoslavianYumanYup'ikZimbabwean
Immigration
NonimmigrantsImmigrantsAfghanistanAfricaAlbaniaArgentinaArmeniaAsiaAustraliaAustriaBahamasBangladeshBarbadosBelarusBelgiumBelizeBoliviaBosnia and HerzegovinaBrazilBulgariaBurma/MyanmarCabo VerdeCambodiaCameroonCanadaCaribbeanCentral AmericaChileChinaColombiaCongoCosta RicaCroatiaCubaCzechoslovakiaDenmarkDominicaDominican RepublicEastern AfricaEastern AsiaEastern EuropeEcuadorEgyptEl SalvadorEnglandEritreaEthiopiaEuropeFijiFranceGermanyGhanaGreeceGrenadaGuatemalaGuyanaHaitiHondurasHong KongHungaryIndiaIndonesiaIranIraqIrelandIsraelItalyJamaicaJapanJordanKazakhstanKenyaKoreaKuwaitLaosLatin AmericaLatviaLebanonLiberiaLithuaniaMalaysiaMexicoMicronesiaMiddle AfricaMoldovaMoroccoNepalNetherlandsNicaraguaNigeriaNorth AmericaNorth MacedoniaNorthern AfricaNorthern EuropeNorwayOceaniaPakistanPanamaPeruPhilippinesPolandPortugalRomaniaRussiaSaudi ArabiaScotlandSenegalSerbiaSierra LeoneSingaporeSomaliaSouth AfricaSouth Central AsiaSouth Eastern AsiaSouthern EuropeSpainSri LankaSt. Vincent and the GrenadinesSudanSwedenSwitzerlandSyriaTaiwanThailandTrinidad and TobagoTurkeyUgandaUkraineUruguayUzbekistanVenezuelaVietnamWest IndiesWestern AfricaWestern AsiaWestern EuropeYemenZaireZimbabweAzores
Householder Income Ages 45 - 64 years
Income
Poverty
Unemployment
Labor Participation
Family Structure
Vehicle Availability
Education Level
Disability

Householder Income Ages 45 - 64 years Comparison

Immigrants from South America

Immigrants from Egypt

Fair
Exceptional
$99,126
HOUSEHOLDER INCOME AGES 45 - 64 YEARS
35.4/ 100
METRIC RATING
189th/ 347
METRIC RANK
$109,941
HOUSEHOLDER INCOME AGES 45 - 64 YEARS
99.2/ 100
METRIC RATING
74th/ 347
METRIC RANK

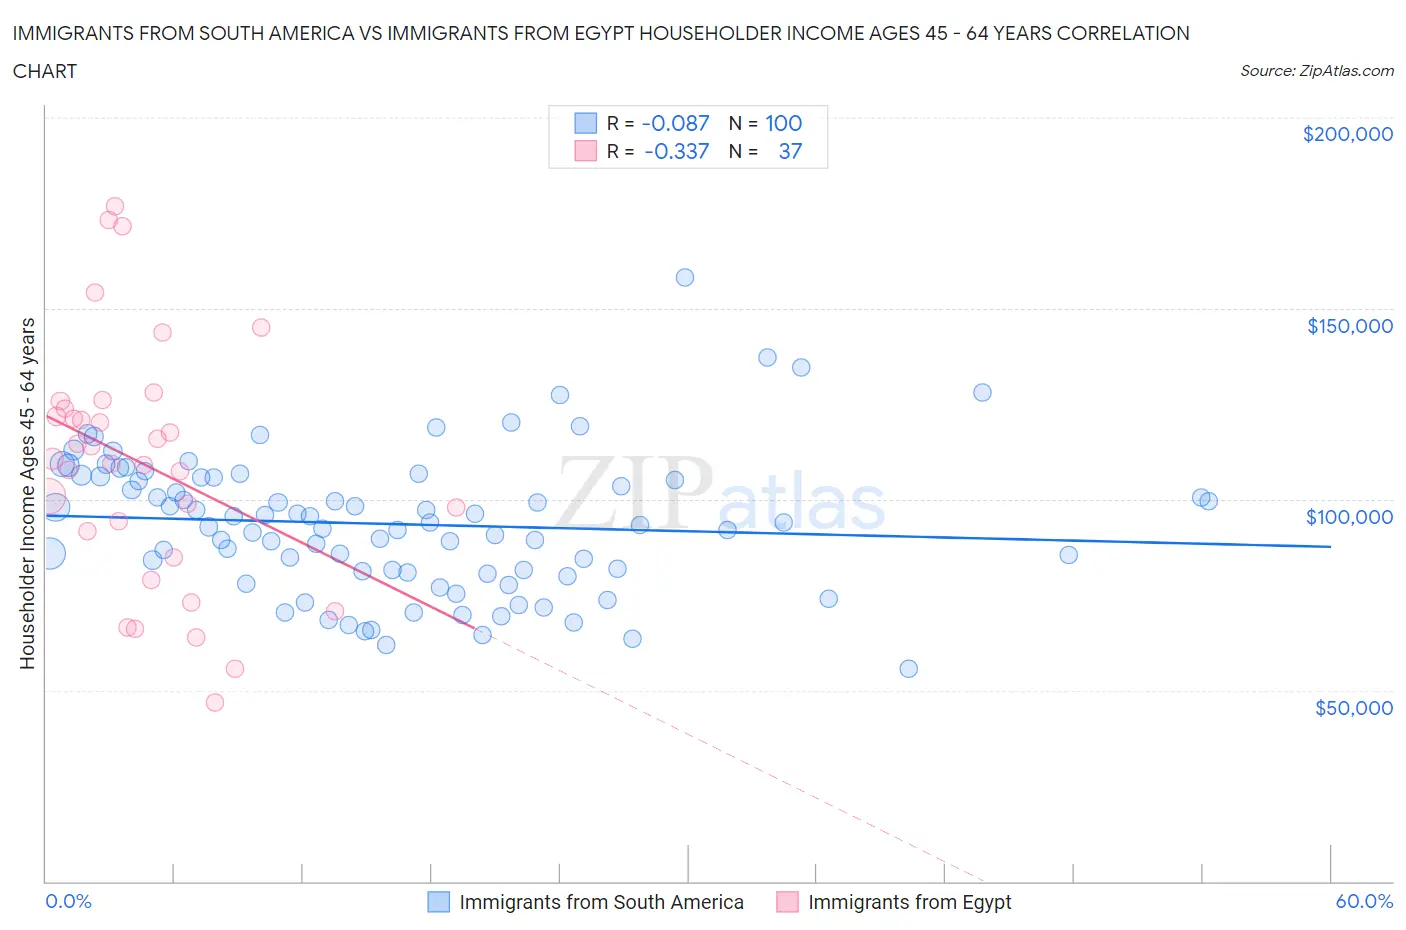
Immigrants from South America vs Immigrants from Egypt Householder Income Ages 45 - 64 years Correlation Chart

The statistical analysis conducted on geographies consisting of 485,109,583 people shows a slight negative correlation between the proportion of Immigrants from South America and household income with householder between the ages 45 and 64 in the United States with a correlation coefficient (R) of -0.087 and weighted average of $99,126. Similarly, the statistical analysis conducted on geographies consisting of 245,345,786 people shows a mild negative correlation between the proportion of Immigrants from Egypt and household income with householder between the ages 45 and 64 in the United States with a correlation coefficient (R) of -0.337 and weighted average of $109,941, a difference of 10.9%.
Immigrants from South America vs Immigrants from Egypt Householder Income Ages 45 - 64 years

Householder Income Ages 45 - 64 years Correlation Summary

MeasurementImmigrants from South AmericaImmigrants from Egypt
Minimum$55,625$46,773
Maximum$158,009$176,674
Range$102,384$129,901
Mean$93,526$109,415
Median$93,699$110,780
Interquartile 25% (IQ1)$80,877$88,195
Interquartile 75% (IQ3)$105,801$124,792
Interquartile Range (IQR)$24,923$36,597
Standard Deviation (Sample)$18,231$31,863
Standard Deviation (Population)$18,139$31,429

Similar Demographics by Householder Income Ages 45 - 64 years

Demographics Similar to Immigrants from South America by Householder Income Ages 45 - 64 years

In terms of householder income ages 45 - 64 years, the demographic groups most similar to Immigrants from South America are French Canadian ($99,093, a difference of 0.030%), Immigrants from Portugal ($99,203, a difference of 0.080%), Kenyan ($98,970, a difference of 0.16%), Celtic ($98,896, a difference of 0.23%), and Iraqi ($99,387, a difference of 0.26%).
DemographicsRating | RankHouseholder Income Ages 45 - 64 years
Finns
44.8
/100
|
#182
Average
$99,904
Spaniards
44.6
/100
|
#183
Average
$99,889
French
43.8
/100
|
#184
Average
$99,824
Colombians
43.2
/100
|
#185
Average
$99,772
Dutch
41.7
/100
|
#186
Average
$99,650
Iraqis
38.5
/100
|
#187
Fair
$99,387
Immigrants | Portugal
36.3
/100
|
#188
Fair
$99,203
Immigrants | South America
35.4
/100
|
#189
Fair
$99,126
French Canadians
35.1
/100
|
#190
Fair
$99,093
Kenyans
33.7
/100
|
#191
Fair
$98,970
Celtics
32.9
/100
|
#192
Fair
$98,896
Hawaiians
31.6
/100
|
#193
Fair
$98,778
Uruguayans
30.3
/100
|
#194
Fair
$98,660
Spanish
29.2
/100
|
#195
Fair
$98,554
Immigrants | Eastern Africa
28.3
/100
|
#196
Fair
$98,467

Demographics Similar to Immigrants from Egypt by Householder Income Ages 45 - 64 years

In terms of householder income ages 45 - 64 years, the demographic groups most similar to Immigrants from Egypt are Argentinean ($110,103, a difference of 0.15%), South African ($109,719, a difference of 0.20%), Assyrian/Chaldean/Syriac ($110,201, a difference of 0.24%), Italian ($110,224, a difference of 0.26%), and Korean ($110,334, a difference of 0.36%).
DemographicsRating | RankHouseholder Income Ages 45 - 64 years
Laotians
99.5
/100
|
#67
Exceptional
$111,051
Immigrants | Romania
99.4
/100
|
#68
Exceptional
$110,633
Immigrants | Italy
99.4
/100
|
#69
Exceptional
$110,434
Koreans
99.3
/100
|
#70
Exceptional
$110,334
Italians
99.3
/100
|
#71
Exceptional
$110,224
Assyrians/Chaldeans/Syriacs
99.3
/100
|
#72
Exceptional
$110,201
Argentineans
99.3
/100
|
#73
Exceptional
$110,103
Immigrants | Egypt
99.2
/100
|
#74
Exceptional
$109,941
South Africans
99.1
/100
|
#75
Exceptional
$109,719
Paraguayans
99.0
/100
|
#76
Exceptional
$109,447
Immigrants | England
99.0
/100
|
#77
Exceptional
$109,446
Immigrants | Canada
99.0
/100
|
#78
Exceptional
$109,402
Immigrants | Bulgaria
98.9
/100
|
#79
Exceptional
$109,379
Jordanians
98.9
/100
|
#80
Exceptional
$109,376
Immigrants | Eastern Europe
98.9
/100
|
#81
Exceptional
$109,335