Immigrants from Somalia vs Spanish American Median Household Income
COMPARE
Immigrants from Somalia
Spanish American
Median Household Income
Median Household Income Comparison
Immigrants from Somalia
Spanish Americans
$74,300
MEDIAN HOUSEHOLD INCOME
0.1/ 100
METRIC RATING
286th/ 347
METRIC RANK
$75,386
MEDIAN HOUSEHOLD INCOME
0.2/ 100
METRIC RATING
277th/ 347
METRIC RANK
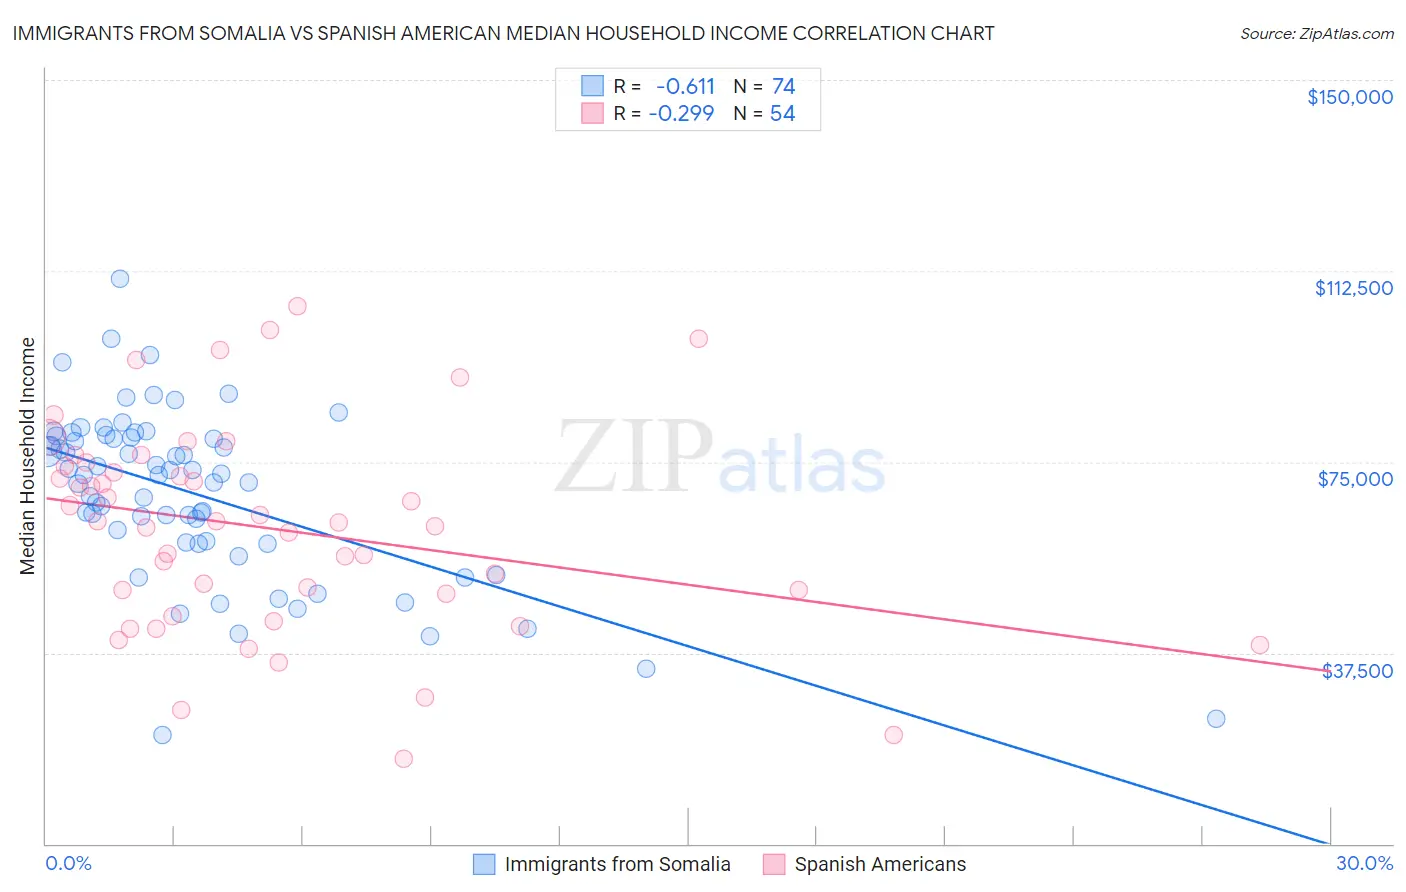
Immigrants from Somalia vs Spanish American Median Household Income Correlation Chart
The statistical analysis conducted on geographies consisting of 92,093,487 people shows a significant negative correlation between the proportion of Immigrants from Somalia and median household income in the United States with a correlation coefficient (R) of -0.611 and weighted average of $74,300. Similarly, the statistical analysis conducted on geographies consisting of 103,163,457 people shows a weak negative correlation between the proportion of Spanish Americans and median household income in the United States with a correlation coefficient (R) of -0.299 and weighted average of $75,386, a difference of 1.5%.
Median Household Income Correlation Summary
| Measurement | Immigrants from Somalia | Spanish American |
| Minimum | $21,288 | $16,806 |
| Maximum | $111,048 | $105,648 |
| Range | $89,760 | $88,842 |
| Mean | $68,739 | $61,918 |
| Median | $72,392 | $63,227 |
| Interquartile 25% (IQ1) | $59,132 | $49,158 |
| Interquartile 75% (IQ3) | $79,747 | $74,166 |
| Interquartile Range (IQR) | $20,615 | $25,008 |
| Standard Deviation (Sample) | $16,683 | $20,311 |
| Standard Deviation (Population) | $16,570 | $20,122 |
Demographics Similar to Immigrants from Somalia and Spanish Americans by Median Household Income
In terms of median household income, the demographic groups most similar to Immigrants from Somalia are Iroquois ($74,279, a difference of 0.030%), Immigrants from Central America ($74,217, a difference of 0.11%), Mexican ($74,399, a difference of 0.13%), Fijian ($74,205, a difference of 0.13%), and Bangladeshi ($74,112, a difference of 0.25%). Similarly, the demographic groups most similar to Spanish Americans are Immigrants from Latin America ($75,420, a difference of 0.040%), Osage ($75,240, a difference of 0.19%), Immigrants from Micronesia ($75,574, a difference of 0.25%), British West Indian ($75,647, a difference of 0.35%), and Immigrants from Guatemala ($75,123, a difference of 0.35%).
| Demographics | Rating | Rank | Median Household Income |
| Pennsylvania Germans | 0.3 /100 | #271 | Tragic $75,814 |
| Somalis | 0.3 /100 | #272 | Tragic $75,782 |
| Liberians | 0.2 /100 | #273 | Tragic $75,667 |
| British West Indians | 0.2 /100 | #274 | Tragic $75,647 |
| Immigrants | Micronesia | 0.2 /100 | #275 | Tragic $75,574 |
| Immigrants | Latin America | 0.2 /100 | #276 | Tragic $75,420 |
| Spanish Americans | 0.2 /100 | #277 | Tragic $75,386 |
| Osage | 0.2 /100 | #278 | Tragic $75,240 |
| Immigrants | Guatemala | 0.2 /100 | #279 | Tragic $75,123 |
| Senegalese | 0.2 /100 | #280 | Tragic $74,999 |
| Immigrants | Liberia | 0.1 /100 | #281 | Tragic $74,896 |
| Central American Indians | 0.1 /100 | #282 | Tragic $74,847 |
| Cree | 0.1 /100 | #283 | Tragic $74,685 |
| Yaqui | 0.1 /100 | #284 | Tragic $74,596 |
| Mexicans | 0.1 /100 | #285 | Tragic $74,399 |
| Immigrants | Somalia | 0.1 /100 | #286 | Tragic $74,300 |
| Iroquois | 0.1 /100 | #287 | Tragic $74,279 |
| Immigrants | Central America | 0.1 /100 | #288 | Tragic $74,217 |
| Fijians | 0.1 /100 | #289 | Tragic $74,205 |
| Bangladeshis | 0.1 /100 | #290 | Tragic $74,112 |
| Hispanics or Latinos | 0.1 /100 | #291 | Tragic $73,823 |