Immigrants from Singapore vs Cherokee Householder Income Ages 45 - 64 years

COMPARE

Immigrants from Singapore
Race
Ancestry
AfghanAfricanAlaska NativeAlaskan AthabascanAlbanianAleutAlsatianAmericanApacheArabArapahoArgentineanArmenianAssyrian/Chaldean/SyriacAustralianAustrianBahamianBangladeshiBarbadianBasqueBelgianBelizeanBermudanBhutaneseBlackfeetBolivianBrazilianBritishBritish West IndianBulgarianBurmeseCajunCambodianCanadianCape VerdeanCarpatho RusynCelticCentral AmericanCentral American IndianCheyenneChickasawChileanChineseChippewaChoctawColombianColvilleComancheCosta RicanCreeCreekCroatianCrowCubanCypriotCzechCzechoslovakianDanishDelawareDominicanDutchDutch West IndianEastern EuropeanEcuadorianEgyptianEnglishEstonianEthiopianEuropeanFijianFilipinoFinnishFrenchFrench American IndianFrench CanadianGermanGerman RussianGhanaianGreekGuamanian/ChamorroGuatemalanGuyaneseHaitianHmongHonduranHopiHoumaHungarianIcelanderIndian (Asian)IndonesianInupiatIranianIraqiIrishIroquoisIsraeliItalianJamaicanJapaneseJordanianKenyanKiowaKoreanLaotianLatvianLebaneseLiberianLithuanianLumbeeLuxembourgerMacedonianMalaysianMalteseMarshalleseMenomineeMexicanMexican American IndianMongolianMoroccanNative HawaiianNavajoNepaleseNew ZealanderNicaraguanNigerianNorthern EuropeanNorwegianOkinawanOsageOttawaPaiutePakistaniPalestinianPanamanianParaguayanPennsylvania GermanPeruvianPimaPolishPortuguesePotawatomiPuebloPuerto RicanPuget Sound SalishRomanianRussianSalvadoranSamoanScandinavianScotch-IrishScottishSeminoleSenegaleseSerbianShoshoneSierra LeoneanSiouxSlavicSlovakSloveneSomaliSouth AfricanSouth AmericanSouth American IndianSoviet UnionSpaniardSpanishSpanish AmericanSpanish American IndianSri LankanSubsaharan AfricanSudaneseSwedishSwissSyrianTaiwaneseThaiTlingit-HaidaTohono O'OdhamTonganTrinidadian and TobagonianTsimshianTurkishU.S. Virgin IslanderUgandanUkrainianUruguayanUteVenezuelanVietnameseWelshWest IndianYakamaYaquiYugoslavianYumanYup'ikZimbabwean
Immigration
NonimmigrantsImmigrantsAfghanistanAfricaAlbaniaArgentinaArmeniaAsiaAustraliaAustriaBahamasBangladeshBarbadosBelarusBelgiumBelizeBoliviaBosnia and HerzegovinaBrazilBulgariaBurma/MyanmarCabo VerdeCambodiaCameroonCanadaCaribbeanCentral AmericaChileChinaColombiaCongoCosta RicaCroatiaCubaCzechoslovakiaDenmarkDominicaDominican RepublicEastern AfricaEastern AsiaEastern EuropeEcuadorEgyptEl SalvadorEnglandEritreaEthiopiaEuropeFijiFranceGermanyGhanaGreeceGrenadaGuatemalaGuyanaHaitiHondurasHong KongHungaryIndiaIndonesiaIranIraqIrelandIsraelItalyJamaicaJapanJordanKazakhstanKenyaKoreaKuwaitLaosLatin AmericaLatviaLebanonLiberiaLithuaniaMalaysiaMexicoMicronesiaMiddle AfricaMoldovaMoroccoNepalNetherlandsNicaraguaNigeriaNorth AmericaNorth MacedoniaNorthern AfricaNorthern EuropeNorwayOceaniaPakistanPanamaPeruPhilippinesPolandPortugalRomaniaRussiaSaudi ArabiaScotlandSenegalSerbiaSierra LeoneSingaporeSomaliaSouth AfricaSouth AmericaSouth Central AsiaSouth Eastern AsiaSouthern EuropeSpainSri LankaSt. Vincent and the GrenadinesSudanSwedenSwitzerlandSyriaTaiwanThailandTrinidad and TobagoTurkeyUgandaUkraineUruguayUzbekistanVenezuelaVietnamWest IndiesWestern AfricaWestern AsiaWestern EuropeYemenZaireZimbabweAzores
Cherokee
Race
Ancestry
AfghanAfricanAlaska NativeAlaskan AthabascanAlbanianAleutAlsatianAmericanApacheArabArapahoArgentineanArmenianAssyrian/Chaldean/SyriacAustralianAustrianBahamianBangladeshiBarbadianBasqueBelgianBelizeanBermudanBhutaneseBlackfeetBolivianBrazilianBritishBritish West IndianBulgarianBurmeseCajunCambodianCanadianCape VerdeanCarpatho RusynCelticCentral AmericanCentral American IndianCherokeeCheyenneChickasawChileanChineseChippewaChoctawColombianColvilleComancheCosta RicanCreeCreekCroatianCrowCubanCypriotCzechCzechoslovakianDanishDelawareDominicanDutchDutch West IndianEastern EuropeanEcuadorianEgyptianEnglishEstonianEthiopianEuropeanFijianFilipinoFinnishFrenchFrench American IndianFrench CanadianGermanGerman RussianGhanaianGreekGuamanian/ChamorroGuatemalanGuyaneseHaitianHmongHonduranHopiHoumaHungarianIcelanderIndian (Asian)IndonesianInupiatIranianIraqiIrishIroquoisIsraeliItalianJamaicanJapaneseJordanianKenyanKiowaKoreanLaotianLatvianLebaneseLiberianLithuanianLumbeeLuxembourgerMacedonianMalaysianMalteseMarshalleseMenomineeMexicanMexican American IndianMongolianMoroccanNative HawaiianNavajoNepaleseNew ZealanderNicaraguanNigerianNorthern EuropeanNorwegianOkinawanOsageOttawaPaiutePakistaniPalestinianPanamanianParaguayanPennsylvania GermanPeruvianPimaPolishPortuguesePotawatomiPuebloPuerto RicanPuget Sound SalishRomanianRussianSalvadoranSamoanScandinavianScotch-IrishScottishSeminoleSenegaleseSerbianShoshoneSierra LeoneanSiouxSlavicSlovakSloveneSomaliSouth AfricanSouth AmericanSouth American IndianSoviet UnionSpaniardSpanishSpanish AmericanSpanish American IndianSri LankanSubsaharan AfricanSudaneseSwedishSwissSyrianTaiwaneseThaiTlingit-HaidaTohono O'OdhamTonganTrinidadian and TobagonianTsimshianTurkishU.S. Virgin IslanderUgandanUkrainianUruguayanUteVenezuelanVietnameseWelshWest IndianYakamaYaquiYugoslavianYumanYup'ikZimbabwean
Immigration
NonimmigrantsImmigrantsAfghanistanAfricaAlbaniaArgentinaArmeniaAsiaAustraliaAustriaBahamasBangladeshBarbadosBelarusBelgiumBelizeBoliviaBosnia and HerzegovinaBrazilBulgariaBurma/MyanmarCabo VerdeCambodiaCameroonCanadaCaribbeanCentral AmericaChileChinaColombiaCongoCosta RicaCroatiaCubaCzechoslovakiaDenmarkDominicaDominican RepublicEastern AfricaEastern AsiaEastern EuropeEcuadorEgyptEl SalvadorEnglandEritreaEthiopiaEuropeFijiFranceGermanyGhanaGreeceGrenadaGuatemalaGuyanaHaitiHondurasHong KongHungaryIndiaIndonesiaIranIraqIrelandIsraelItalyJamaicaJapanJordanKazakhstanKenyaKoreaKuwaitLaosLatin AmericaLatviaLebanonLiberiaLithuaniaMalaysiaMexicoMicronesiaMiddle AfricaMoldovaMoroccoNepalNetherlandsNicaraguaNigeriaNorth AmericaNorth MacedoniaNorthern AfricaNorthern EuropeNorwayOceaniaPakistanPanamaPeruPhilippinesPolandPortugalRomaniaRussiaSaudi ArabiaScotlandSenegalSerbiaSierra LeoneSomaliaSouth AfricaSouth AmericaSouth Central AsiaSouth Eastern AsiaSouthern EuropeSpainSri LankaSt. Vincent and the GrenadinesSudanSwedenSwitzerlandSyriaTaiwanThailandTrinidad and TobagoTurkeyUgandaUkraineUruguayUzbekistanVenezuelaVietnamWest IndiesWestern AfricaWestern AsiaWestern EuropeYemenZaireZimbabweAzores
Householder Income Ages 45 - 64 years
Income
Poverty
Unemployment
Labor Participation
Family Structure
Vehicle Availability
Education Level
Disability

Householder Income Ages 45 - 64 years Comparison

Immigrants from Singapore

Cherokee

Exceptional
Tragic
$129,514
HOUSEHOLDER INCOME AGES 45 - 64 YEARS
100.0/ 100
METRIC RATING
5th/ 347
METRIC RANK
$86,125
HOUSEHOLDER INCOME AGES 45 - 64 YEARS
0.1/ 100
METRIC RATING
290th/ 347
METRIC RANK

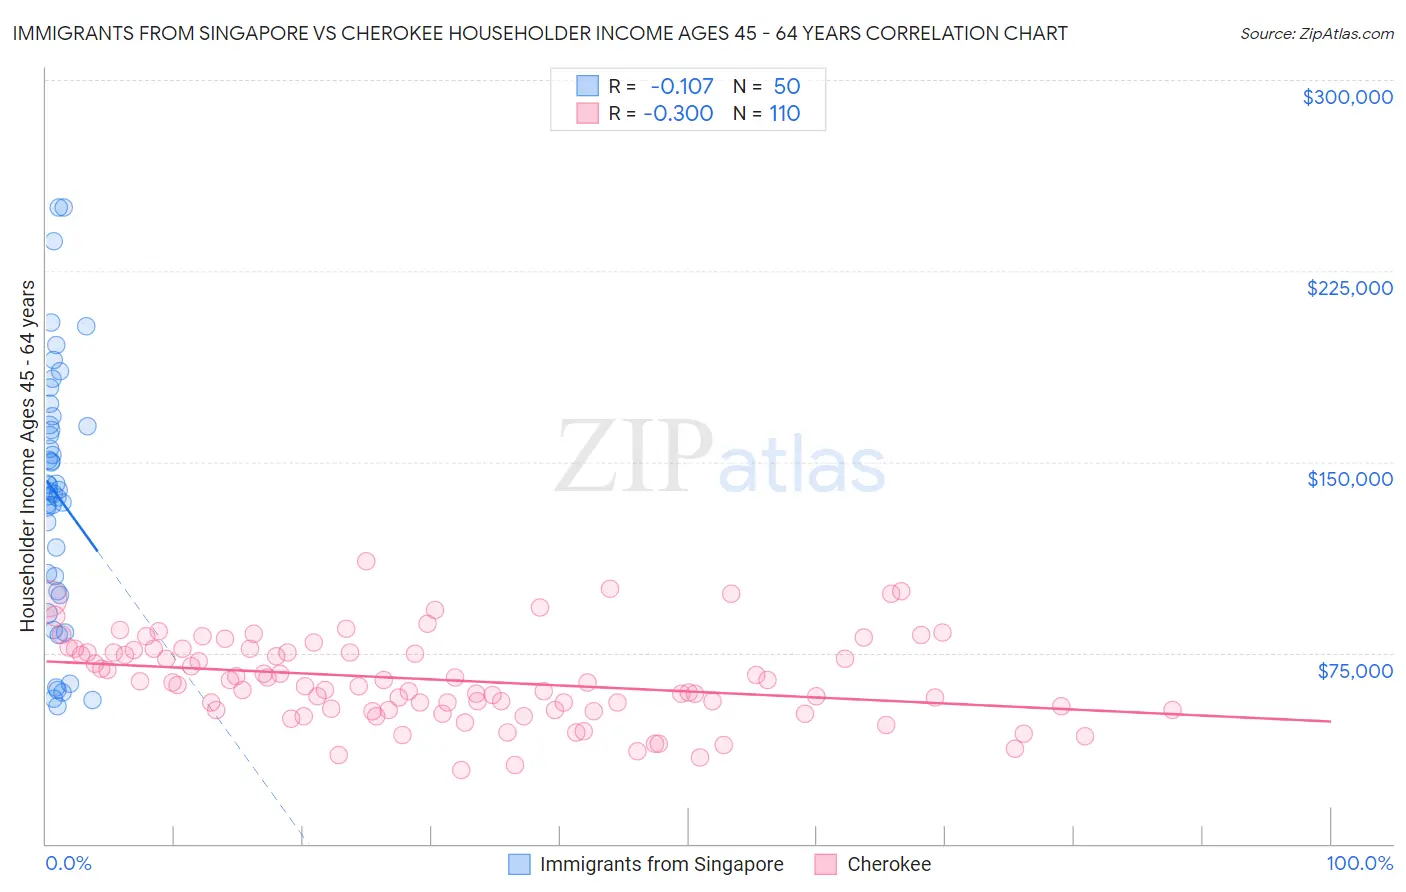
Immigrants from Singapore vs Cherokee Householder Income Ages 45 - 64 years Correlation Chart

The statistical analysis conducted on geographies consisting of 137,361,337 people shows a poor negative correlation between the proportion of Immigrants from Singapore and household income with householder between the ages 45 and 64 in the United States with a correlation coefficient (R) of -0.107 and weighted average of $129,514. Similarly, the statistical analysis conducted on geographies consisting of 491,799,921 people shows a mild negative correlation between the proportion of Cherokee and household income with householder between the ages 45 and 64 in the United States with a correlation coefficient (R) of -0.300 and weighted average of $86,125, a difference of 50.4%.
Immigrants from Singapore vs Cherokee Householder Income Ages 45 - 64 years

Householder Income Ages 45 - 64 years Correlation Summary

MeasurementImmigrants from SingaporeCherokee
Minimum$54,074$29,177
Maximum$250,001$110,921
Range$195,927$81,743
Mean$137,475$64,277
Median$138,678$62,715
Interquartile 25% (IQ1)$99,063$52,500
Interquartile 75% (IQ3)$164,348$76,245
Interquartile Range (IQR)$65,285$23,745
Standard Deviation (Sample)$49,976$16,781
Standard Deviation (Population)$49,474$16,705

Similar Demographics by Householder Income Ages 45 - 64 years

Demographics Similar to Immigrants from Singapore by Householder Income Ages 45 - 64 years

In terms of householder income ages 45 - 64 years, the demographic groups most similar to Immigrants from Singapore are Thai ($129,560, a difference of 0.040%), Iranian ($129,350, a difference of 0.13%), Immigrants from Hong Kong ($127,500, a difference of 1.6%), Immigrants from Iran ($126,940, a difference of 2.0%), and Immigrants from India ($132,488, a difference of 2.3%).
DemographicsRating | RankHouseholder Income Ages 45 - 64 years
Immigrants | Taiwan
100.0
/100
|
#1
Exceptional
$135,508
Filipinos
100.0
/100
|
#2
Exceptional
$134,910
Immigrants | India
100.0
/100
|
#3
Exceptional
$132,488
Thais
100.0
/100
|
#4
Exceptional
$129,560
Immigrants | Singapore
100.0
/100
|
#5
Exceptional
$129,514
Iranians
100.0
/100
|
#6
Exceptional
$129,350
Immigrants | Hong Kong
100.0
/100
|
#7
Exceptional
$127,500
Immigrants | Iran
100.0
/100
|
#8
Exceptional
$126,940
Okinawans
100.0
/100
|
#9
Exceptional
$124,796
Immigrants | South Central Asia
100.0
/100
|
#10
Exceptional
$124,188
Cypriots
100.0
/100
|
#11
Exceptional
$123,396
Immigrants | Israel
100.0
/100
|
#12
Exceptional
$122,893
Immigrants | Ireland
100.0
/100
|
#13
Exceptional
$122,757
Indians (Asian)
100.0
/100
|
#14
Exceptional
$122,343
Immigrants | Eastern Asia
100.0
/100
|
#15
Exceptional
$122,222

Demographics Similar to Cherokee by Householder Income Ages 45 - 64 years

In terms of householder income ages 45 - 64 years, the demographic groups most similar to Cherokee are Hispanic or Latino ($86,006, a difference of 0.14%), Immigrants from Central America ($85,965, a difference of 0.19%), Cuban ($86,301, a difference of 0.20%), Immigrants from St. Vincent and the Grenadines ($86,394, a difference of 0.31%), and Bangladeshi ($86,402, a difference of 0.32%).
DemographicsRating | RankHouseholder Income Ages 45 - 64 years
Mexicans
0.1
/100
|
#283
Tragic
$86,816
Central American Indians
0.1
/100
|
#284
Tragic
$86,764
Blackfeet
0.1
/100
|
#285
Tragic
$86,595
Immigrants | Guatemala
0.1
/100
|
#286
Tragic
$86,573
Bangladeshis
0.1
/100
|
#287
Tragic
$86,402
Immigrants | St. Vincent and the Grenadines
0.1
/100
|
#288
Tragic
$86,394
Cubans
0.1
/100
|
#289
Tragic
$86,301
Cherokee
0.1
/100
|
#290
Tragic
$86,125
Hispanics or Latinos
0.1
/100
|
#291
Tragic
$86,006
Immigrants | Central America
0.1
/100
|
#292
Tragic
$85,965
Comanche
0.1
/100
|
#293
Tragic
$85,787
British West Indians
0.1
/100
|
#294
Tragic
$85,571
Immigrants | Grenada
0.1
/100
|
#295
Tragic
$85,552
Immigrants | Zaire
0.1
/100
|
#296
Tragic
$85,207
Fijians
0.1
/100
|
#297
Tragic
$85,187