Immigrants from Sierra Leone vs Slovene Median Family Income
COMPARE
Immigrants from Sierra Leone
Slovene
Median Family Income
Median Family Income Comparison
Immigrants from Sierra Leone
Slovenes
$103,990
MEDIAN FAMILY INCOME
66.2/ 100
METRIC RATING
162nd/ 347
METRIC RANK
$106,020
MEDIAN FAMILY INCOME
84.7/ 100
METRIC RATING
142nd/ 347
METRIC RANK
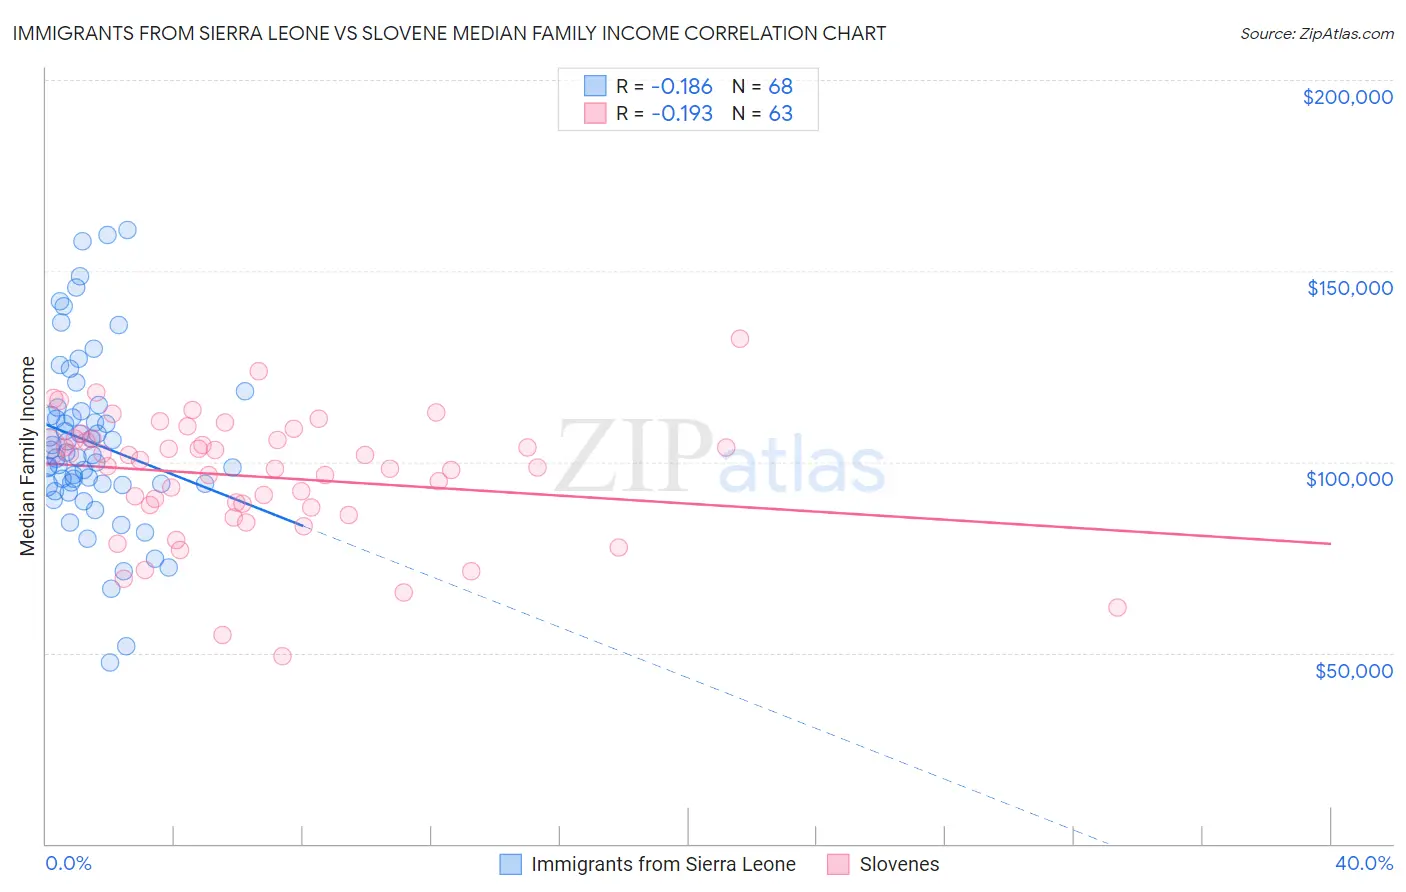
Immigrants from Sierra Leone vs Slovene Median Family Income Correlation Chart
The statistical analysis conducted on geographies consisting of 101,644,998 people shows a poor negative correlation between the proportion of Immigrants from Sierra Leone and median family income in the United States with a correlation coefficient (R) of -0.186 and weighted average of $103,990. Similarly, the statistical analysis conducted on geographies consisting of 261,214,906 people shows a poor negative correlation between the proportion of Slovenes and median family income in the United States with a correlation coefficient (R) of -0.193 and weighted average of $106,020, a difference of 1.9%.
Median Family Income Correlation Summary
| Measurement | Immigrants from Sierra Leone | Slovene |
| Minimum | $47,578 | $48,984 |
| Maximum | $160,863 | $132,096 |
| Range | $113,285 | $83,112 |
| Mean | $105,117 | $96,087 |
| Median | $102,019 | $98,910 |
| Interquartile 25% (IQ1) | $94,047 | $88,135 |
| Interquartile 75% (IQ3) | $113,626 | $105,910 |
| Interquartile Range (IQR) | $19,580 | $17,775 |
| Standard Deviation (Sample) | $22,846 | $16,283 |
| Standard Deviation (Population) | $22,677 | $16,153 |
Demographics Similar to Immigrants from Sierra Leone and Slovenes by Median Family Income
In terms of median family income, the demographic groups most similar to Immigrants from Sierra Leone are Icelander ($104,282, a difference of 0.28%), Scottish ($104,288, a difference of 0.29%), Swiss ($104,396, a difference of 0.39%), Scandinavian ($104,410, a difference of 0.40%), and Moroccan ($104,488, a difference of 0.48%). Similarly, the demographic groups most similar to Slovenes are Tongan ($105,967, a difference of 0.050%), Immigrants from Morocco ($105,964, a difference of 0.050%), Danish ($105,900, a difference of 0.11%), Czech ($105,839, a difference of 0.17%), and Immigrants from Chile ($105,655, a difference of 0.35%).
| Demographics | Rating | Rank | Median Family Income |
| Slovenes | 84.7 /100 | #142 | Excellent $106,020 |
| Tongans | 84.3 /100 | #143 | Excellent $105,967 |
| Immigrants | Morocco | 84.3 /100 | #144 | Excellent $105,964 |
| Danes | 83.8 /100 | #145 | Excellent $105,900 |
| Czechs | 83.4 /100 | #146 | Excellent $105,839 |
| Immigrants | Chile | 82.1 /100 | #147 | Excellent $105,655 |
| Hungarians | 81.7 /100 | #148 | Excellent $105,609 |
| Immigrants | Germany | 80.9 /100 | #149 | Excellent $105,507 |
| Irish | 80.5 /100 | #150 | Excellent $105,453 |
| Peruvians | 80.4 /100 | #151 | Excellent $105,444 |
| Immigrants | Albania | 79.1 /100 | #152 | Good $105,285 |
| Slavs | 77.9 /100 | #153 | Good $105,144 |
| Immigrants | Nepal | 76.3 /100 | #154 | Good $104,966 |
| Native Hawaiians | 75.8 /100 | #155 | Good $104,910 |
| Basques | 74.4 /100 | #156 | Good $104,760 |
| Moroccans | 71.6 /100 | #157 | Good $104,488 |
| Scandinavians | 70.8 /100 | #158 | Good $104,410 |
| Swiss | 70.7 /100 | #159 | Good $104,396 |
| Scottish | 69.5 /100 | #160 | Good $104,288 |
| Icelanders | 69.4 /100 | #161 | Good $104,282 |
| Immigrants | Sierra Leone | 66.2 /100 | #162 | Good $103,990 |