Immigrants from Saudi Arabia vs Immigrants from Burma/Myanmar Householder Income Ages 25 - 44 years
COMPARE
Immigrants from Saudi Arabia
Immigrants from Burma/Myanmar
Householder Income Ages 25 - 44 years
Householder Income Ages 25 - 44 years Comparison
Immigrants from Saudi Arabia
Immigrants from Burma/Myanmar
$95,450
HOUSEHOLDER INCOME AGES 25 - 44 YEARS
62.0/ 100
METRIC RATING
163rd/ 347
METRIC RANK
$86,736
HOUSEHOLDER INCOME AGES 25 - 44 YEARS
1.3/ 100
METRIC RATING
246th/ 347
METRIC RANK
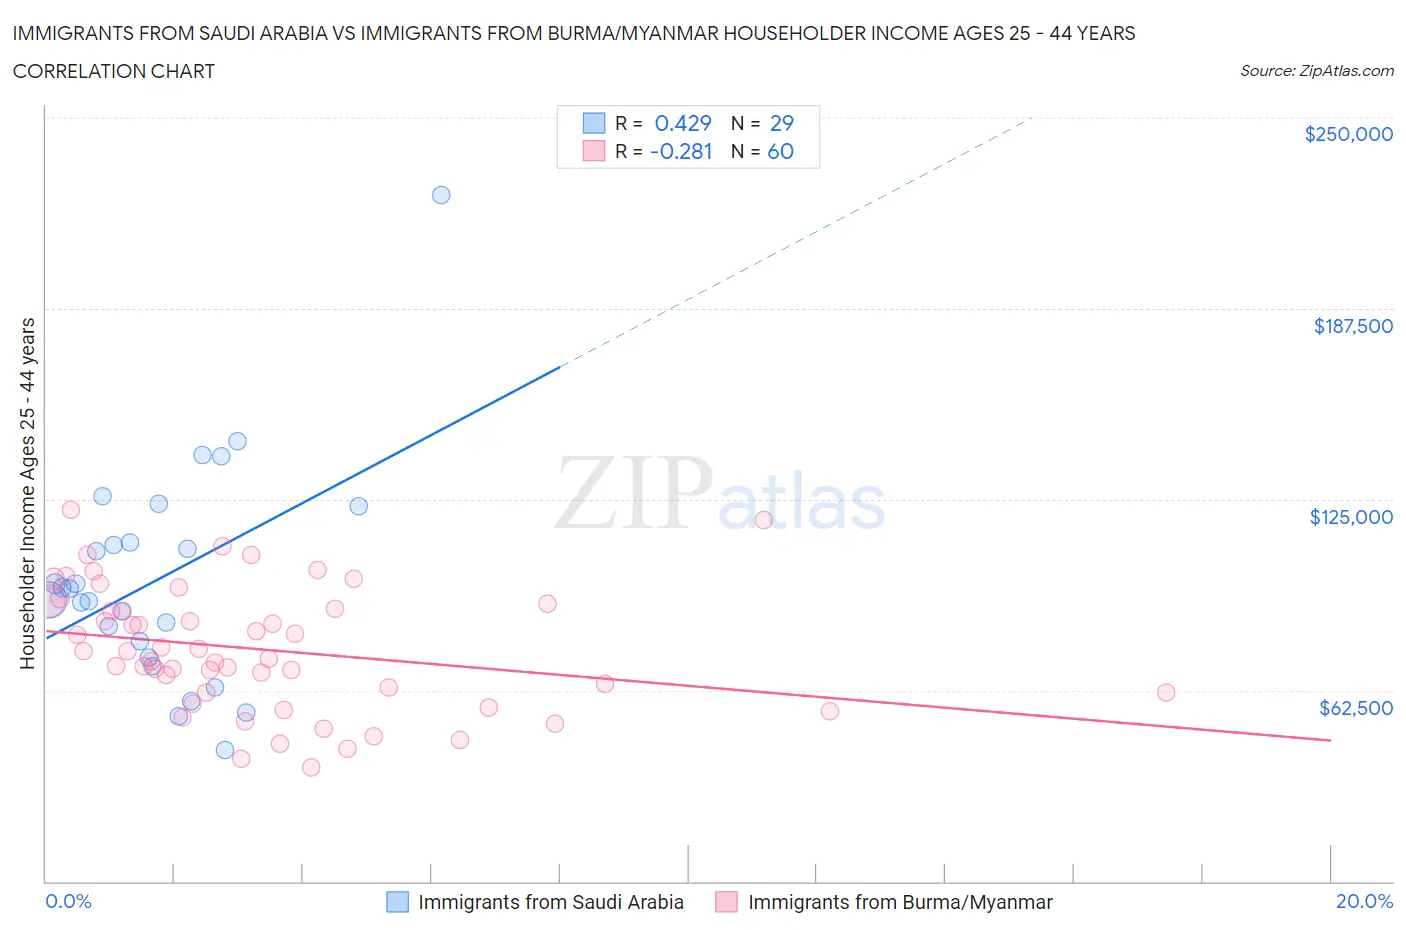
Immigrants from Saudi Arabia vs Immigrants from Burma/Myanmar Householder Income Ages 25 - 44 years Correlation Chart
The statistical analysis conducted on geographies consisting of 164,160,916 people shows a moderate positive correlation between the proportion of Immigrants from Saudi Arabia and household income with householder between the ages 25 and 44 in the United States with a correlation coefficient (R) of 0.429 and weighted average of $95,450. Similarly, the statistical analysis conducted on geographies consisting of 172,191,155 people shows a weak negative correlation between the proportion of Immigrants from Burma/Myanmar and household income with householder between the ages 25 and 44 in the United States with a correlation coefficient (R) of -0.281 and weighted average of $86,736, a difference of 10.1%.
Householder Income Ages 25 - 44 years Correlation Summary
| Measurement | Immigrants from Saudi Arabia | Immigrants from Burma/Myanmar |
| Minimum | $42,908 | $37,365 |
| Maximum | $224,728 | $121,540 |
| Range | $181,820 | $84,175 |
| Mean | $99,059 | $75,885 |
| Median | $95,793 | $73,968 |
| Interquartile 25% (IQ1) | $75,904 | $61,794 |
| Interquartile 75% (IQ3) | $116,882 | $90,078 |
| Interquartile Range (IQR) | $40,978 | $28,284 |
| Standard Deviation (Sample) | $35,873 | $20,099 |
| Standard Deviation (Population) | $35,249 | $19,931 |
Similar Demographics by Householder Income Ages 25 - 44 years
Demographics Similar to Immigrants from Saudi Arabia by Householder Income Ages 25 - 44 years
In terms of householder income ages 25 - 44 years, the demographic groups most similar to Immigrants from Saudi Arabia are Swiss ($95,511, a difference of 0.060%), Immigrants from Portugal ($95,512, a difference of 0.070%), South American ($95,362, a difference of 0.090%), Icelander ($95,560, a difference of 0.11%), and Costa Rican ($95,565, a difference of 0.12%).
| Demographics | Rating | Rank | Householder Income Ages 25 - 44 years |
| Immigrants | Germany | 67.9 /100 | #156 | Good $95,913 |
| Immigrants | Uganda | 65.2 /100 | #157 | Good $95,698 |
| Scandinavians | 63.9 /100 | #158 | Good $95,596 |
| Costa Ricans | 63.5 /100 | #159 | Good $95,565 |
| Icelanders | 63.4 /100 | #160 | Good $95,560 |
| Immigrants | Portugal | 62.8 /100 | #161 | Good $95,512 |
| Swiss | 62.8 /100 | #162 | Good $95,511 |
| Immigrants | Saudi Arabia | 62.0 /100 | #163 | Good $95,450 |
| South Americans | 60.9 /100 | #164 | Good $95,362 |
| Immigrants | Nepal | 60.3 /100 | #165 | Good $95,322 |
| Immigrants | Ethiopia | 59.5 /100 | #166 | Average $95,256 |
| Czechoslovakians | 57.0 /100 | #167 | Average $95,070 |
| Alsatians | 56.8 /100 | #168 | Average $95,059 |
| Native Hawaiians | 56.8 /100 | #169 | Average $95,058 |
| Slovaks | 56.4 /100 | #170 | Average $95,032 |
Demographics Similar to Immigrants from Burma/Myanmar by Householder Income Ages 25 - 44 years
In terms of householder income ages 25 - 44 years, the demographic groups most similar to Immigrants from Burma/Myanmar are Immigrants from Nigeria ($86,589, a difference of 0.17%), Immigrants from El Salvador ($86,913, a difference of 0.20%), Immigrants from Venezuela ($87,038, a difference of 0.35%), Immigrants from West Indies ($87,063, a difference of 0.38%), and West Indian ($87,205, a difference of 0.54%).
| Demographics | Rating | Rank | Householder Income Ages 25 - 44 years |
| Immigrants | Ghana | 2.2 /100 | #239 | Tragic $87,760 |
| Nicaraguans | 2.2 /100 | #240 | Tragic $87,751 |
| Nigerians | 2.2 /100 | #241 | Tragic $87,730 |
| West Indians | 1.7 /100 | #242 | Tragic $87,205 |
| Immigrants | West Indies | 1.5 /100 | #243 | Tragic $87,063 |
| Immigrants | Venezuela | 1.5 /100 | #244 | Tragic $87,038 |
| Immigrants | El Salvador | 1.4 /100 | #245 | Tragic $86,913 |
| Immigrants | Burma/Myanmar | 1.3 /100 | #246 | Tragic $86,736 |
| Immigrants | Nigeria | 1.2 /100 | #247 | Tragic $86,589 |
| Immigrants | Sudan | 0.9 /100 | #248 | Tragic $86,109 |
| French American Indians | 0.8 /100 | #249 | Tragic $85,899 |
| Pennsylvania Germans | 0.8 /100 | #250 | Tragic $85,836 |
| Cape Verdeans | 0.8 /100 | #251 | Tragic $85,758 |
| Immigrants | Western Africa | 0.7 /100 | #252 | Tragic $85,676 |
| British West Indians | 0.7 /100 | #253 | Tragic $85,565 |