Immigrants from Romania vs Romanian Median Family Income
COMPARE
Immigrants from Romania
Romanian
Median Family Income
Median Family Income Comparison
Immigrants from Romania
Romanians
$113,434
MEDIAN FAMILY INCOME
99.6/ 100
METRIC RATING
70th/ 347
METRIC RANK
$111,243
MEDIAN FAMILY INCOME
98.8/ 100
METRIC RATING
88th/ 347
METRIC RANK
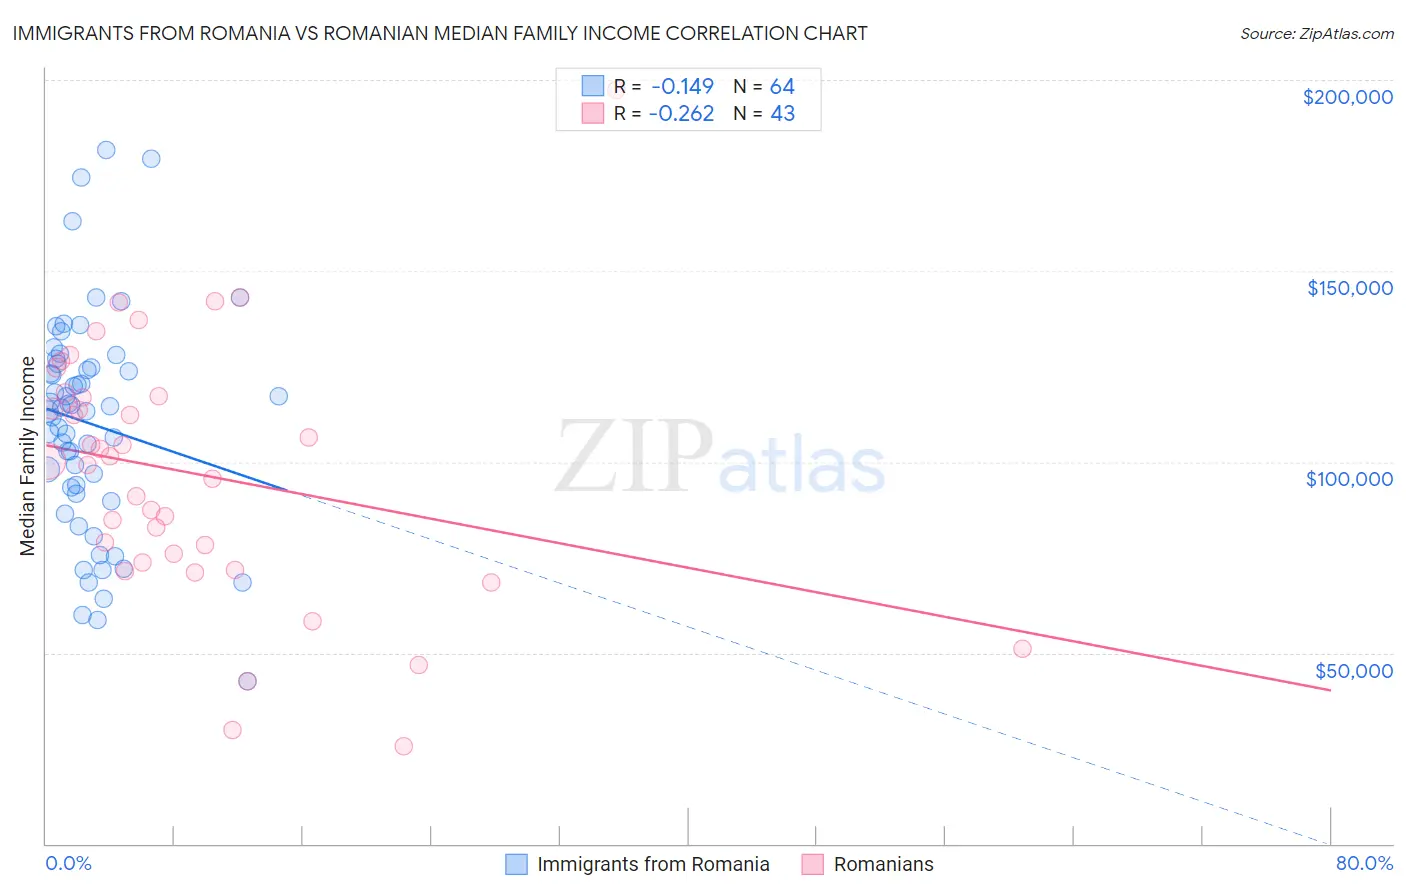
Immigrants from Romania vs Romanian Median Family Income Correlation Chart
The statistical analysis conducted on geographies consisting of 256,919,145 people shows a poor negative correlation between the proportion of Immigrants from Romania and median family income in the United States with a correlation coefficient (R) of -0.149 and weighted average of $113,434. Similarly, the statistical analysis conducted on geographies consisting of 377,611,628 people shows a weak negative correlation between the proportion of Romanians and median family income in the United States with a correlation coefficient (R) of -0.262 and weighted average of $111,243, a difference of 2.0%.
Median Family Income Correlation Summary
| Measurement | Immigrants from Romania | Romanian |
| Minimum | $42,500 | $25,417 |
| Maximum | $181,711 | $197,500 |
| Range | $139,211 | $172,083 |
| Mean | $109,959 | $96,934 |
| Median | $113,781 | $100,017 |
| Interquartile 25% (IQ1) | $92,391 | $73,551 |
| Interquartile 75% (IQ3) | $125,210 | $117,024 |
| Interquartile Range (IQR) | $32,820 | $43,473 |
| Standard Deviation (Sample) | $28,709 | $33,876 |
| Standard Deviation (Population) | $28,484 | $33,480 |
Demographics Similar to Immigrants from Romania and Romanians by Median Family Income
In terms of median family income, the demographic groups most similar to Immigrants from Romania are Immigrants from Bulgaria ($113,461, a difference of 0.020%), South African ($113,229, a difference of 0.18%), Afghan ($112,971, a difference of 0.41%), Laotian ($112,859, a difference of 0.51%), and Immigrants from Italy ($112,848, a difference of 0.52%). Similarly, the demographic groups most similar to Romanians are Austrian ($111,306, a difference of 0.060%), Croatian ($111,370, a difference of 0.11%), Ukrainian ($111,368, a difference of 0.11%), Immigrants from Hungary ($111,378, a difference of 0.12%), and Immigrants from Argentina ($110,873, a difference of 0.33%).
| Demographics | Rating | Rank | Median Family Income |
| Immigrants | Bulgaria | 99.6 /100 | #69 | Exceptional $113,461 |
| Immigrants | Romania | 99.6 /100 | #70 | Exceptional $113,434 |
| South Africans | 99.5 /100 | #71 | Exceptional $113,229 |
| Afghans | 99.5 /100 | #72 | Exceptional $112,971 |
| Laotians | 99.5 /100 | #73 | Exceptional $112,859 |
| Immigrants | Italy | 99.4 /100 | #74 | Exceptional $112,848 |
| Immigrants | Western Europe | 99.4 /100 | #75 | Exceptional $112,688 |
| Argentineans | 99.4 /100 | #76 | Exceptional $112,665 |
| Immigrants | Eastern Europe | 99.4 /100 | #77 | Exceptional $112,527 |
| Immigrants | Canada | 99.3 /100 | #78 | Exceptional $112,374 |
| Italians | 99.3 /100 | #79 | Exceptional $112,372 |
| Immigrants | Croatia | 99.3 /100 | #80 | Exceptional $112,323 |
| Immigrants | North America | 99.2 /100 | #81 | Exceptional $112,151 |
| Immigrants | England | 99.2 /100 | #82 | Exceptional $112,038 |
| Immigrants | Egypt | 99.0 /100 | #83 | Exceptional $111,689 |
| Immigrants | Hungary | 98.8 /100 | #84 | Exceptional $111,378 |
| Croatians | 98.8 /100 | #85 | Exceptional $111,370 |
| Ukrainians | 98.8 /100 | #86 | Exceptional $111,368 |
| Austrians | 98.8 /100 | #87 | Exceptional $111,306 |
| Romanians | 98.8 /100 | #88 | Exceptional $111,243 |
| Immigrants | Argentina | 98.5 /100 | #89 | Exceptional $110,873 |