Immigrants from Portugal vs Immigrants from Jordan Householder Income Under 25 years

COMPARE

Immigrants from Portugal
Race
Ancestry
AfghanAfricanAlaska NativeAlaskan AthabascanAlbanianAleutAlsatianAmericanApacheArabArapahoArgentineanArmenianAssyrian/Chaldean/SyriacAustralianAustrianBahamianBangladeshiBarbadianBasqueBelgianBelizeanBermudanBhutaneseBlackfeetBolivianBrazilianBritishBritish West IndianBulgarianBurmeseCajunCambodianCanadianCape VerdeanCarpatho RusynCelticCentral AmericanCentral American IndianCherokeeCheyenneChickasawChileanChineseChippewaChoctawColombianColvilleComancheCosta RicanCreeCreekCroatianCrowCubanCypriotCzechCzechoslovakianDanishDelawareDominicanDutchDutch West IndianEastern EuropeanEcuadorianEgyptianEnglishEstonianEthiopianEuropeanFijianFilipinoFinnishFrenchFrench American IndianFrench CanadianGermanGerman RussianGhanaianGreekGuamanian/ChamorroGuatemalanGuyaneseHaitianHmongHonduranHopiHoumaHungarianIcelanderIndian (Asian)IndonesianInupiatIranianIraqiIrishIroquoisIsraeliItalianJamaicanJapaneseJordanianKenyanKiowaKoreanLaotianLatvianLebaneseLiberianLithuanianLumbeeLuxembourgerMacedonianMalaysianMalteseMarshalleseMenomineeMexicanMexican American IndianMongolianMoroccanNative HawaiianNavajoNepaleseNew ZealanderNicaraguanNigerianNorthern EuropeanNorwegianOkinawanOsageOttawaPaiutePakistaniPalestinianPanamanianParaguayanPennsylvania GermanPeruvianPimaPolishPortuguesePotawatomiPuebloPuerto RicanPuget Sound SalishRomanianRussianSalvadoranSamoanScandinavianScotch-IrishScottishSeminoleSenegaleseSerbianShoshoneSierra LeoneanSiouxSlavicSlovakSloveneSomaliSouth AfricanSouth AmericanSouth American IndianSoviet UnionSpaniardSpanishSpanish AmericanSpanish American IndianSri LankanSubsaharan AfricanSudaneseSwedishSwissSyrianTaiwaneseThaiTlingit-HaidaTohono O'OdhamTonganTrinidadian and TobagonianTsimshianTurkishU.S. Virgin IslanderUgandanUkrainianUruguayanUteVenezuelanVietnameseWelshWest IndianYakamaYaquiYugoslavianYumanYup'ikZimbabwean
Immigration
NonimmigrantsImmigrantsAfghanistanAfricaAlbaniaArgentinaArmeniaAsiaAustraliaAustriaBahamasBangladeshBarbadosBelarusBelgiumBelizeBoliviaBosnia and HerzegovinaBrazilBulgariaBurma/MyanmarCabo VerdeCambodiaCameroonCanadaCaribbeanCentral AmericaChileChinaColombiaCongoCosta RicaCroatiaCubaCzechoslovakiaDenmarkDominicaDominican RepublicEastern AfricaEastern AsiaEastern EuropeEcuadorEgyptEl SalvadorEnglandEritreaEthiopiaEuropeFijiFranceGermanyGhanaGreeceGrenadaGuatemalaGuyanaHaitiHondurasHong KongHungaryIndiaIndonesiaIranIraqIrelandIsraelItalyJamaicaJapanKazakhstanKenyaKoreaKuwaitLaosLatin AmericaLatviaLebanonLiberiaLithuaniaMalaysiaMexicoMicronesiaMiddle AfricaMoldovaMoroccoNepalNetherlandsNicaraguaNigeriaNorth AmericaNorth MacedoniaNorthern AfricaNorthern EuropeNorwayOceaniaPakistanPanamaPeruPhilippinesPolandPortugalRomaniaRussiaSaudi ArabiaScotlandSenegalSerbiaSierra LeoneSingaporeSomaliaSouth AfricaSouth AmericaSouth Central AsiaSouth Eastern AsiaSouthern EuropeSpainSri LankaSt. Vincent and the GrenadinesSudanSwedenSwitzerlandSyriaTaiwanThailandTrinidad and TobagoTurkeyUgandaUkraineUruguayUzbekistanVenezuelaVietnamWest IndiesWestern AfricaWestern AsiaWestern EuropeYemenZaireZimbabweAzores
Immigrants from Jordan
Race
Ancestry
AfghanAfricanAlaska NativeAlaskan AthabascanAlbanianAleutAlsatianAmericanApacheArabArapahoArgentineanArmenianAssyrian/Chaldean/SyriacAustralianAustrianBahamianBangladeshiBarbadianBasqueBelgianBelizeanBermudanBhutaneseBlackfeetBolivianBrazilianBritishBritish West IndianBulgarianBurmeseCajunCambodianCanadianCape VerdeanCarpatho RusynCelticCentral AmericanCentral American IndianCherokeeCheyenneChickasawChileanChineseChippewaChoctawColombianColvilleComancheCosta RicanCreeCreekCroatianCrowCubanCypriotCzechCzechoslovakianDanishDelawareDominicanDutchDutch West IndianEastern EuropeanEcuadorianEgyptianEnglishEstonianEthiopianEuropeanFijianFilipinoFinnishFrenchFrench American IndianFrench CanadianGermanGerman RussianGhanaianGreekGuamanian/ChamorroGuatemalanGuyaneseHaitianHmongHonduranHopiHoumaHungarianIcelanderIndian (Asian)IndonesianInupiatIranianIraqiIrishIroquoisIsraeliItalianJamaicanJapaneseJordanianKenyanKiowaKoreanLaotianLatvianLebaneseLiberianLithuanianLumbeeLuxembourgerMacedonianMalaysianMalteseMarshalleseMenomineeMexicanMexican American IndianMongolianMoroccanNative HawaiianNavajoNepaleseNew ZealanderNicaraguanNigerianNorthern EuropeanNorwegianOkinawanOsageOttawaPaiutePakistaniPalestinianPanamanianParaguayanPennsylvania GermanPeruvianPimaPolishPortuguesePotawatomiPuebloPuerto RicanPuget Sound SalishRomanianRussianSalvadoranSamoanScandinavianScotch-IrishScottishSeminoleSenegaleseSerbianShoshoneSierra LeoneanSiouxSlavicSlovakSloveneSomaliSouth AfricanSouth AmericanSouth American IndianSoviet UnionSpaniardSpanishSpanish AmericanSpanish American IndianSri LankanSubsaharan AfricanSudaneseSwedishSwissSyrianTaiwaneseThaiTlingit-HaidaTohono O'OdhamTonganTrinidadian and TobagonianTsimshianTurkishU.S. Virgin IslanderUgandanUkrainianUruguayanUteVenezuelanVietnameseWelshWest IndianYakamaYaquiYugoslavianYumanYup'ikZimbabwean
Immigration
NonimmigrantsImmigrantsAfghanistanAfricaAlbaniaArgentinaArmeniaAsiaAustraliaAustriaBahamasBangladeshBarbadosBelarusBelgiumBelizeBoliviaBosnia and HerzegovinaBrazilBulgariaBurma/MyanmarCabo VerdeCambodiaCameroonCanadaCaribbeanCentral AmericaChileChinaColombiaCongoCosta RicaCroatiaCubaCzechoslovakiaDenmarkDominicaDominican RepublicEastern AfricaEastern AsiaEastern EuropeEcuadorEgyptEl SalvadorEnglandEritreaEthiopiaEuropeFijiFranceGermanyGhanaGreeceGrenadaGuatemalaGuyanaHaitiHondurasHong KongHungaryIndiaIndonesiaIranIraqIrelandIsraelItalyJamaicaJapanJordanKazakhstanKenyaKoreaKuwaitLaosLatin AmericaLatviaLebanonLiberiaLithuaniaMalaysiaMexicoMicronesiaMiddle AfricaMoldovaMoroccoNepalNetherlandsNicaraguaNigeriaNorth AmericaNorth MacedoniaNorthern AfricaNorthern EuropeNorwayOceaniaPakistanPanamaPeruPhilippinesPolandRomaniaRussiaSaudi ArabiaScotlandSenegalSerbiaSierra LeoneSingaporeSomaliaSouth AfricaSouth AmericaSouth Central AsiaSouth Eastern AsiaSouthern EuropeSpainSri LankaSt. Vincent and the GrenadinesSudanSwedenSwitzerlandSyriaTaiwanThailandTrinidad and TobagoTurkeyUgandaUkraineUruguayUzbekistanVenezuelaVietnamWest IndiesWestern AfricaWestern AsiaWestern EuropeYemenZaireZimbabweAzores
Householder Income Under 25 years
Income
Poverty
Unemployment
Labor Participation
Family Structure
Vehicle Availability
Education Level
Disability

Householder Income Under 25 years Comparison

Immigrants from Portugal

Immigrants from Jordan

Exceptional
Poor
$54,105
HOUSEHOLDER INCOME UNDER 25 YEARS
99.1/ 100
METRIC RATING
97th/ 347
METRIC RANK
$51,370
HOUSEHOLDER INCOME UNDER 25 YEARS
11.9/ 100
METRIC RATING
208th/ 347
METRIC RANK

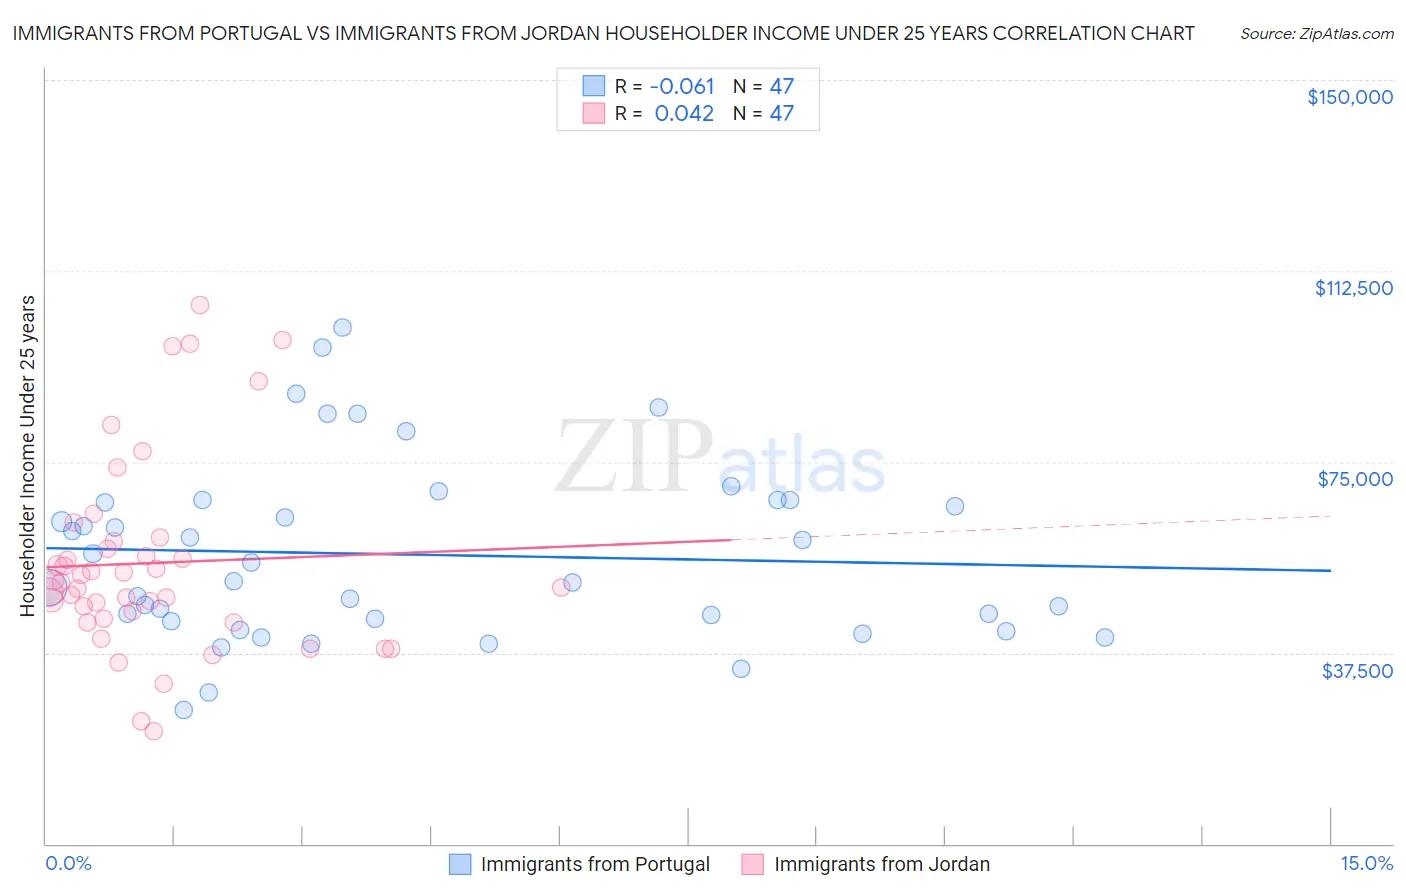
Immigrants from Portugal vs Immigrants from Jordan Householder Income Under 25 years Correlation Chart

The statistical analysis conducted on geographies consisting of 149,512,592 people shows a slight negative correlation between the proportion of Immigrants from Portugal and household income with householder under the age of 25 in the United States with a correlation coefficient (R) of -0.061 and weighted average of $54,105. Similarly, the statistical analysis conducted on geographies consisting of 163,486,233 people shows no correlation between the proportion of Immigrants from Jordan and household income with householder under the age of 25 in the United States with a correlation coefficient (R) of 0.042 and weighted average of $51,370, a difference of 5.3%.
Immigrants from Portugal vs Immigrants from Jordan Householder Income Under 25 years

Householder Income Under 25 years Correlation Summary

MeasurementImmigrants from PortugalImmigrants from Jordan
Minimum$26,161$22,102
Maximum$101,440$105,714
Range$75,279$83,612
Mean$56,802$55,122
Median$51,667$51,314
Interquartile 25% (IQ1)$43,800$44,180
Interquartile 75% (IQ3)$67,515$59,421
Interquartile Range (IQR)$23,715$15,241
Standard Deviation (Sample)$17,633$18,968
Standard Deviation (Population)$17,444$18,765

Similar Demographics by Householder Income Under 25 years

Demographics Similar to Immigrants from Portugal by Householder Income Under 25 years

In terms of householder income under 25 years, the demographic groups most similar to Immigrants from Portugal are Eastern European ($54,066, a difference of 0.070%), Argentinean ($54,154, a difference of 0.090%), Immigrants from Malaysia ($54,179, a difference of 0.14%), Immigrants from Sierra Leone ($54,190, a difference of 0.16%), and Immigrants from Argentina ($54,209, a difference of 0.19%).
DemographicsRating | RankHouseholder Income Under 25 years
Turks
99.4
/100
|
#90
Exceptional
$54,266
Immigrants | Egypt
99.3
/100
|
#91
Exceptional
$54,239
Immigrants | St. Vincent and the Grenadines
99.3
/100
|
#92
Exceptional
$54,230
Immigrants | Argentina
99.3
/100
|
#93
Exceptional
$54,209
Immigrants | Sierra Leone
99.3
/100
|
#94
Exceptional
$54,190
Immigrants | Malaysia
99.2
/100
|
#95
Exceptional
$54,179
Argentineans
99.2
/100
|
#96
Exceptional
$54,154
Immigrants | Portugal
99.1
/100
|
#97
Exceptional
$54,105
Eastern Europeans
99.0
/100
|
#98
Exceptional
$54,066
Alaska Natives
98.8
/100
|
#99
Exceptional
$54,000
Immigrants | Kazakhstan
98.8
/100
|
#100
Exceptional
$53,990
South Americans
98.6
/100
|
#101
Exceptional
$53,939
Ecuadorians
98.5
/100
|
#102
Exceptional
$53,911
Ukrainians
98.3
/100
|
#103
Exceptional
$53,843
Ethiopians
98.2
/100
|
#104
Exceptional
$53,818

Demographics Similar to Immigrants from Jordan by Householder Income Under 25 years

In terms of householder income under 25 years, the demographic groups most similar to Immigrants from Jordan are South African ($51,383, a difference of 0.020%), Cape Verdean ($51,387, a difference of 0.030%), Immigrants from Latin America ($51,387, a difference of 0.030%), Syrian ($51,353, a difference of 0.030%), and Immigrants from Ghana ($51,333, a difference of 0.070%).
DemographicsRating | RankHouseholder Income Under 25 years
British
14.9
/100
|
#201
Poor
$51,477
Immigrants | Guatemala
14.0
/100
|
#202
Poor
$51,447
Immigrants | Cameroon
13.6
/100
|
#203
Poor
$51,433
Czechs
13.2
/100
|
#204
Poor
$51,421
Cape Verdeans
12.3
/100
|
#205
Poor
$51,387
Immigrants | Latin America
12.3
/100
|
#206
Poor
$51,387
South Africans
12.2
/100
|
#207
Poor
$51,383
Immigrants | Jordan
11.9
/100
|
#208
Poor
$51,370
Syrians
11.4
/100
|
#209
Poor
$51,353
Immigrants | Ghana
10.9
/100
|
#210
Poor
$51,333
Irish
10.6
/100
|
#211
Poor
$51,317
Immigrants | Panama
9.7
/100
|
#212
Tragic
$51,278
Dutch
9.4
/100
|
#213
Tragic
$51,265
Zimbabweans
9.3
/100
|
#214
Tragic
$51,259
Icelanders
9.1
/100
|
#215
Tragic
$51,247