Immigrants from Philippines vs Immigrants from Ghana Householder Income Ages 25 - 44 years

COMPARE

Immigrants from Philippines
Race
Ancestry
AfghanAfricanAlaska NativeAlaskan AthabascanAlbanianAleutAlsatianAmericanApacheArabArapahoArgentineanArmenianAssyrian/Chaldean/SyriacAustralianAustrianBahamianBangladeshiBarbadianBasqueBelgianBelizeanBermudanBhutaneseBlackfeetBolivianBrazilianBritishBritish West IndianBulgarianBurmeseCajunCambodianCanadianCape VerdeanCarpatho RusynCelticCentral AmericanCentral American IndianCherokeeCheyenneChickasawChileanChineseChippewaChoctawColombianColvilleComancheCosta RicanCreeCreekCroatianCrowCubanCypriotCzechCzechoslovakianDanishDelawareDominicanDutchDutch West IndianEastern EuropeanEcuadorianEgyptianEnglishEstonianEthiopianEuropeanFijianFilipinoFinnishFrenchFrench American IndianFrench CanadianGermanGerman RussianGhanaianGreekGuamanian/ChamorroGuatemalanGuyaneseHaitianHmongHonduranHopiHoumaHungarianIcelanderIndian (Asian)IndonesianInupiatIranianIraqiIrishIroquoisIsraeliItalianJamaicanJapaneseJordanianKenyanKiowaKoreanLaotianLatvianLebaneseLiberianLithuanianLumbeeLuxembourgerMacedonianMalaysianMalteseMarshalleseMenomineeMexicanMexican American IndianMongolianMoroccanNative HawaiianNavajoNepaleseNew ZealanderNicaraguanNigerianNorthern EuropeanNorwegianOkinawanOsageOttawaPaiutePakistaniPalestinianPanamanianParaguayanPennsylvania GermanPeruvianPimaPolishPortuguesePotawatomiPuebloPuerto RicanPuget Sound SalishRomanianRussianSalvadoranSamoanScandinavianScotch-IrishScottishSeminoleSenegaleseSerbianShoshoneSierra LeoneanSiouxSlavicSlovakSloveneSomaliSouth AfricanSouth AmericanSouth American IndianSoviet UnionSpaniardSpanishSpanish AmericanSpanish American IndianSri LankanSubsaharan AfricanSudaneseSwedishSwissSyrianTaiwaneseThaiTlingit-HaidaTohono O'OdhamTonganTrinidadian and TobagonianTsimshianTurkishU.S. Virgin IslanderUgandanUkrainianUruguayanUteVenezuelanVietnameseWelshWest IndianYakamaYaquiYugoslavianYumanYup'ikZimbabwean
Immigration
NonimmigrantsImmigrantsAfghanistanAfricaAlbaniaArgentinaArmeniaAsiaAustraliaAustriaBahamasBangladeshBarbadosBelarusBelgiumBelizeBoliviaBosnia and HerzegovinaBrazilBulgariaBurma/MyanmarCabo VerdeCambodiaCameroonCanadaCaribbeanCentral AmericaChileChinaColombiaCongoCosta RicaCroatiaCubaCzechoslovakiaDenmarkDominicaDominican RepublicEastern AfricaEastern AsiaEastern EuropeEcuadorEgyptEl SalvadorEnglandEritreaEthiopiaEuropeFijiFranceGermanyGreeceGrenadaGuatemalaGuyanaHaitiHondurasHong KongHungaryIndiaIndonesiaIranIraqIrelandIsraelItalyJamaicaJapanJordanKazakhstanKenyaKoreaKuwaitLaosLatin AmericaLatviaLebanonLiberiaLithuaniaMalaysiaMexicoMicronesiaMiddle AfricaMoldovaMoroccoNepalNetherlandsNicaraguaNigeriaNorth AmericaNorth MacedoniaNorthern AfricaNorthern EuropeNorwayOceaniaPakistanPanamaPeruPhilippinesPolandPortugalRomaniaRussiaSaudi ArabiaScotlandSenegalSerbiaSierra LeoneSingaporeSomaliaSouth AfricaSouth AmericaSouth Central AsiaSouth Eastern AsiaSouthern EuropeSpainSri LankaSt. Vincent and the GrenadinesSudanSwedenSwitzerlandSyriaTaiwanThailandTrinidad and TobagoTurkeyUgandaUkraineUruguayUzbekistanVenezuelaVietnamWest IndiesWestern AfricaWestern AsiaWestern EuropeYemenZaireZimbabweAzores
Immigrants from Ghana
Race
Ancestry
AfghanAfricanAlaska NativeAlaskan AthabascanAlbanianAleutAlsatianAmericanApacheArabArapahoArgentineanArmenianAssyrian/Chaldean/SyriacAustralianAustrianBahamianBangladeshiBarbadianBasqueBelgianBelizeanBermudanBhutaneseBlackfeetBolivianBrazilianBritishBritish West IndianBulgarianBurmeseCajunCambodianCanadianCape VerdeanCarpatho RusynCelticCentral AmericanCentral American IndianCherokeeCheyenneChickasawChileanChineseChippewaChoctawColombianColvilleComancheCosta RicanCreeCreekCroatianCrowCubanCypriotCzechCzechoslovakianDanishDelawareDominicanDutchDutch West IndianEastern EuropeanEcuadorianEgyptianEnglishEstonianEthiopianEuropeanFijianFilipinoFinnishFrenchFrench American IndianFrench CanadianGermanGerman RussianGhanaianGreekGuamanian/ChamorroGuatemalanGuyaneseHaitianHmongHonduranHopiHoumaHungarianIcelanderIndian (Asian)IndonesianInupiatIranianIraqiIrishIroquoisIsraeliItalianJamaicanJapaneseJordanianKenyanKiowaKoreanLaotianLatvianLebaneseLiberianLithuanianLumbeeLuxembourgerMacedonianMalaysianMalteseMarshalleseMenomineeMexicanMexican American IndianMongolianMoroccanNative HawaiianNavajoNepaleseNew ZealanderNicaraguanNigerianNorthern EuropeanNorwegianOkinawanOsageOttawaPaiutePakistaniPalestinianPanamanianParaguayanPennsylvania GermanPeruvianPimaPolishPortuguesePotawatomiPuebloPuerto RicanPuget Sound SalishRomanianRussianSalvadoranSamoanScandinavianScotch-IrishScottishSeminoleSenegaleseSerbianShoshoneSierra LeoneanSiouxSlavicSlovakSloveneSomaliSouth AfricanSouth AmericanSouth American IndianSoviet UnionSpaniardSpanishSpanish AmericanSpanish American IndianSri LankanSubsaharan AfricanSudaneseSwedishSwissSyrianTaiwaneseThaiTlingit-HaidaTohono O'OdhamTonganTrinidadian and TobagonianTsimshianTurkishU.S. Virgin IslanderUgandanUkrainianUruguayanUteVenezuelanVietnameseWelshWest IndianYakamaYaquiYugoslavianYumanYup'ikZimbabwean
Immigration
NonimmigrantsImmigrantsAfghanistanAfricaAlbaniaArgentinaArmeniaAsiaAustraliaAustriaBahamasBangladeshBarbadosBelarusBelgiumBelizeBoliviaBosnia and HerzegovinaBrazilBulgariaBurma/MyanmarCabo VerdeCambodiaCameroonCanadaCaribbeanCentral AmericaChileChinaColombiaCongoCosta RicaCroatiaCubaCzechoslovakiaDenmarkDominicaDominican RepublicEastern AfricaEastern AsiaEastern EuropeEcuadorEgyptEl SalvadorEnglandEritreaEthiopiaEuropeFijiFranceGermanyGhanaGreeceGrenadaGuatemalaGuyanaHaitiHondurasHong KongHungaryIndiaIndonesiaIranIraqIrelandIsraelItalyJamaicaJapanJordanKazakhstanKenyaKoreaKuwaitLaosLatin AmericaLatviaLebanonLiberiaLithuaniaMalaysiaMexicoMicronesiaMiddle AfricaMoldovaMoroccoNepalNetherlandsNicaraguaNigeriaNorth AmericaNorth MacedoniaNorthern AfricaNorthern EuropeNorwayOceaniaPakistanPanamaPeruPolandPortugalRomaniaRussiaSaudi ArabiaScotlandSenegalSerbiaSierra LeoneSingaporeSomaliaSouth AfricaSouth AmericaSouth Central AsiaSouth Eastern AsiaSouthern EuropeSpainSri LankaSt. Vincent and the GrenadinesSudanSwedenSwitzerlandSyriaTaiwanThailandTrinidad and TobagoTurkeyUgandaUkraineUruguayUzbekistanVenezuelaVietnamWest IndiesWestern AfricaWestern AsiaWestern EuropeYemenZaireZimbabweAzores
Householder Income Ages 25 - 44 years
Income
Poverty
Unemployment
Labor Participation
Family Structure
Vehicle Availability
Education Level
Disability

Householder Income Ages 25 - 44 years Comparison

Immigrants from Philippines

Immigrants from Ghana

Exceptional
Tragic
$102,910
HOUSEHOLDER INCOME AGES 25 - 44 YEARS
99.0/ 100
METRIC RATING
84th/ 347
METRIC RANK
$87,760
HOUSEHOLDER INCOME AGES 25 - 44 YEARS
2.2/ 100
METRIC RATING
239th/ 347
METRIC RANK

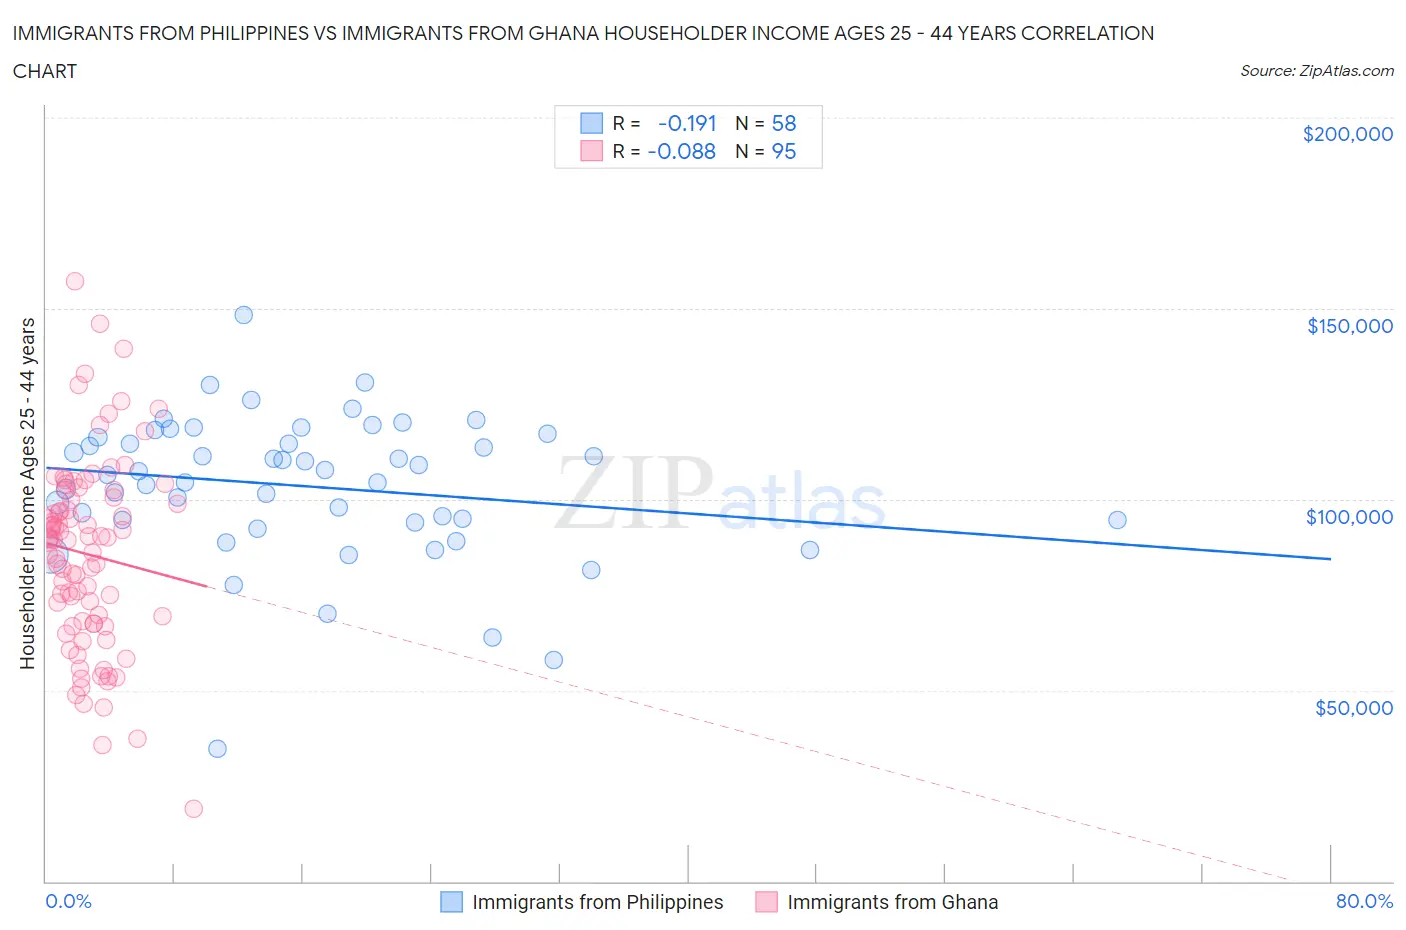
Immigrants from Philippines vs Immigrants from Ghana Householder Income Ages 25 - 44 years Correlation Chart

The statistical analysis conducted on geographies consisting of 469,744,138 people shows a poor negative correlation between the proportion of Immigrants from Philippines and household income with householder between the ages 25 and 44 in the United States with a correlation coefficient (R) of -0.191 and weighted average of $102,910. Similarly, the statistical analysis conducted on geographies consisting of 199,650,351 people shows a slight negative correlation between the proportion of Immigrants from Ghana and household income with householder between the ages 25 and 44 in the United States with a correlation coefficient (R) of -0.088 and weighted average of $87,760, a difference of 17.3%.
Immigrants from Philippines vs Immigrants from Ghana Householder Income Ages 25 - 44 years

Householder Income Ages 25 - 44 years Correlation Summary

MeasurementImmigrants from PhilippinesImmigrants from Ghana
Minimum$34,643$18,980
Maximum$148,401$157,070
Range$113,758$138,090
Mean$103,402$85,645
Median$106,816$89,488
Interquartile 25% (IQ1)$94,583$67,346
Interquartile 75% (IQ3)$116,347$100,333
Interquartile Range (IQR)$21,764$32,987
Standard Deviation (Sample)$19,015$24,889
Standard Deviation (Population)$18,850$24,757

Similar Demographics by Householder Income Ages 25 - 44 years

Demographics Similar to Immigrants from Philippines by Householder Income Ages 25 - 44 years

In terms of householder income ages 25 - 44 years, the demographic groups most similar to Immigrants from Philippines are Argentinean ($103,111, a difference of 0.20%), South African ($103,160, a difference of 0.24%), Immigrants from Serbia ($103,155, a difference of 0.24%), Immigrants from Ukraine ($102,664, a difference of 0.24%), and Immigrants from Hungary ($102,655, a difference of 0.25%).
DemographicsRating | RankHouseholder Income Ages 25 - 44 years
Immigrants | Southern Europe
99.3
/100
|
#77
Exceptional
$103,486
Immigrants | Bulgaria
99.3
/100
|
#78
Exceptional
$103,423
Armenians
99.2
/100
|
#79
Exceptional
$103,248
Immigrants | Egypt
99.2
/100
|
#80
Exceptional
$103,192
South Africans
99.2
/100
|
#81
Exceptional
$103,160
Immigrants | Serbia
99.2
/100
|
#82
Exceptional
$103,155
Argentineans
99.1
/100
|
#83
Exceptional
$103,111
Immigrants | Philippines
99.0
/100
|
#84
Exceptional
$102,910
Immigrants | Ukraine
98.9
/100
|
#85
Exceptional
$102,664
Immigrants | Hungary
98.9
/100
|
#86
Exceptional
$102,655
Immigrants | Western Europe
98.9
/100
|
#87
Exceptional
$102,654
Immigrants | Canada
98.9
/100
|
#88
Exceptional
$102,616
Romanians
98.8
/100
|
#89
Exceptional
$102,544
Ukrainians
98.8
/100
|
#90
Exceptional
$102,451
Croatians
98.7
/100
|
#91
Exceptional
$102,414

Demographics Similar to Immigrants from Ghana by Householder Income Ages 25 - 44 years

In terms of householder income ages 25 - 44 years, the demographic groups most similar to Immigrants from Ghana are Nicaraguan ($87,751, a difference of 0.010%), Nigerian ($87,730, a difference of 0.030%), Alaska Native ($88,018, a difference of 0.29%), Salvadoran ($88,198, a difference of 0.50%), and Immigrants from Cameroon ($88,214, a difference of 0.52%).
DemographicsRating | RankHouseholder Income Ages 25 - 44 years
Immigrants | Nonimmigrants
3.0
/100
|
#232
Tragic
$88,301
Malaysians
3.0
/100
|
#233
Tragic
$88,291
Venezuelans
2.9
/100
|
#234
Tragic
$88,232
Bermudans
2.9
/100
|
#235
Tragic
$88,231
Immigrants | Cameroon
2.9
/100
|
#236
Tragic
$88,214
Salvadorans
2.8
/100
|
#237
Tragic
$88,198
Alaska Natives
2.6
/100
|
#238
Tragic
$88,018
Immigrants | Ghana
2.2
/100
|
#239
Tragic
$87,760
Nicaraguans
2.2
/100
|
#240
Tragic
$87,751
Nigerians
2.2
/100
|
#241
Tragic
$87,730
West Indians
1.7
/100
|
#242
Tragic
$87,205
Immigrants | West Indies
1.5
/100
|
#243
Tragic
$87,063
Immigrants | Venezuela
1.5
/100
|
#244
Tragic
$87,038
Immigrants | El Salvador
1.4
/100
|
#245
Tragic
$86,913
Immigrants | Burma/Myanmar
1.3
/100
|
#246
Tragic
$86,736