Immigrants from Peru vs Brazilian Median Male Earnings
COMPARE
Immigrants from Peru
Brazilian
Median Male Earnings
Median Male Earnings Comparison
Immigrants from Peru
Brazilians
$54,695
MEDIAN MALE EARNINGS
54.9/ 100
METRIC RATING
171st/ 347
METRIC RANK
$56,837
MEDIAN MALE EARNINGS
90.9/ 100
METRIC RATING
127th/ 347
METRIC RANK
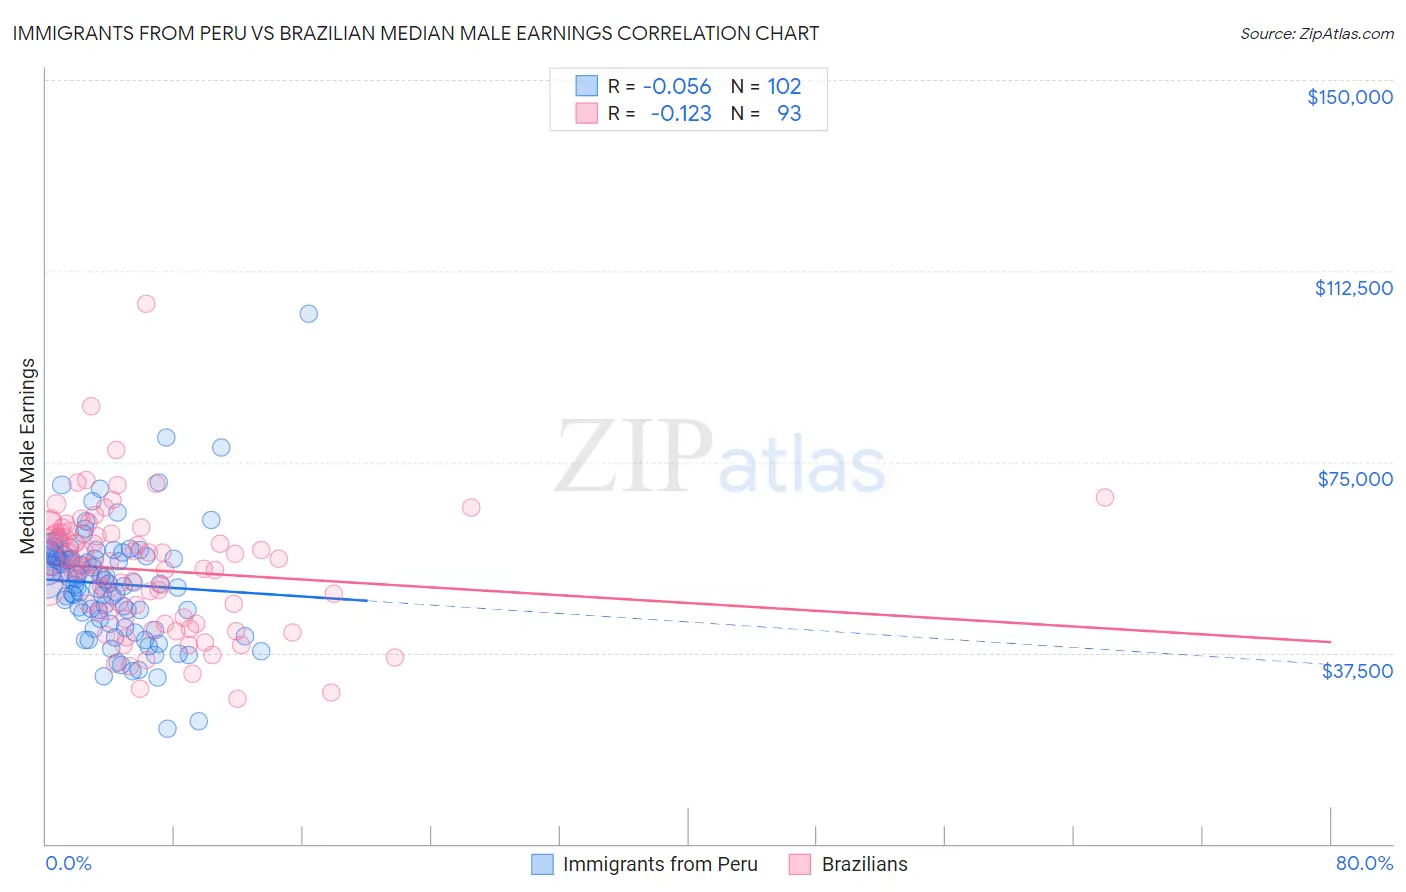
Immigrants from Peru vs Brazilian Median Male Earnings Correlation Chart
The statistical analysis conducted on geographies consisting of 328,805,303 people shows a slight negative correlation between the proportion of Immigrants from Peru and median male earnings in the United States with a correlation coefficient (R) of -0.056 and weighted average of $54,695. Similarly, the statistical analysis conducted on geographies consisting of 323,892,839 people shows a poor negative correlation between the proportion of Brazilians and median male earnings in the United States with a correlation coefficient (R) of -0.123 and weighted average of $56,837, a difference of 3.9%.
Median Male Earnings Correlation Summary
| Measurement | Immigrants from Peru | Brazilian |
| Minimum | $22,560 | $28,554 |
| Maximum | $104,038 | $105,938 |
| Range | $81,478 | $77,384 |
| Mean | $51,057 | $53,733 |
| Median | $51,289 | $54,435 |
| Interquartile 25% (IQ1) | $44,299 | $44,298 |
| Interquartile 75% (IQ3) | $56,461 | $60,844 |
| Interquartile Range (IQR) | $12,162 | $16,546 |
| Standard Deviation (Sample) | $11,444 | $12,418 |
| Standard Deviation (Population) | $11,388 | $12,351 |
Similar Demographics by Median Male Earnings
Demographics Similar to Immigrants from Peru by Median Male Earnings
In terms of median male earnings, the demographic groups most similar to Immigrants from Peru are French Canadian ($54,722, a difference of 0.050%), Finnish ($54,721, a difference of 0.050%), Welsh ($54,647, a difference of 0.090%), South American Indian ($54,508, a difference of 0.34%), and South American ($54,492, a difference of 0.37%).
| Demographics | Rating | Rank | Median Male Earnings |
| Immigrants | South Eastern Asia | 67.6 /100 | #164 | Good $55,241 |
| Immigrants | Portugal | 66.3 /100 | #165 | Good $55,182 |
| Germans | 61.6 /100 | #166 | Good $54,974 |
| Immigrants | Fiji | 61.2 /100 | #167 | Good $54,958 |
| Immigrants | Vietnam | 60.2 /100 | #168 | Good $54,913 |
| French Canadians | 55.6 /100 | #169 | Average $54,722 |
| Finns | 55.6 /100 | #170 | Average $54,721 |
| Immigrants | Peru | 54.9 /100 | #171 | Average $54,695 |
| Welsh | 53.8 /100 | #172 | Average $54,647 |
| South American Indians | 50.4 /100 | #173 | Average $54,508 |
| South Americans | 50.0 /100 | #174 | Average $54,492 |
| Dutch | 48.0 /100 | #175 | Average $54,410 |
| Spaniards | 47.8 /100 | #176 | Average $54,401 |
| Costa Ricans | 44.8 /100 | #177 | Average $54,279 |
| Sierra Leoneans | 44.8 /100 | #178 | Average $54,279 |
Demographics Similar to Brazilians by Median Male Earnings
In terms of median male earnings, the demographic groups most similar to Brazilians are Immigrants from Syria ($56,830, a difference of 0.010%), Chinese ($56,872, a difference of 0.060%), Immigrants from Morocco ($56,958, a difference of 0.21%), Pakistani ($56,719, a difference of 0.21%), and Chilean ($56,973, a difference of 0.24%).
| Demographics | Rating | Rank | Median Male Earnings |
| Canadians | 93.9 /100 | #120 | Exceptional $57,286 |
| Immigrants | Albania | 93.3 /100 | #121 | Exceptional $57,179 |
| Immigrants | Jordan | 93.1 /100 | #122 | Exceptional $57,145 |
| Slovenes | 93.1 /100 | #123 | Exceptional $57,145 |
| Chileans | 91.9 /100 | #124 | Exceptional $56,973 |
| Immigrants | Morocco | 91.8 /100 | #125 | Exceptional $56,958 |
| Chinese | 91.1 /100 | #126 | Exceptional $56,872 |
| Brazilians | 90.9 /100 | #127 | Exceptional $56,837 |
| Immigrants | Syria | 90.8 /100 | #128 | Exceptional $56,830 |
| Pakistanis | 89.9 /100 | #129 | Excellent $56,719 |
| Koreans | 89.4 /100 | #130 | Excellent $56,672 |
| Portuguese | 89.4 /100 | #131 | Excellent $56,663 |
| Czechs | 88.2 /100 | #132 | Excellent $56,546 |
| Immigrants | Germany | 88.2 /100 | #133 | Excellent $56,542 |
| Moroccans | 87.7 /100 | #134 | Excellent $56,499 |