Immigrants from Panama vs Immigrants from Belgium Householder Income Ages 45 - 64 years
COMPARE
Immigrants from Panama
Immigrants from Belgium
Householder Income Ages 45 - 64 years
Householder Income Ages 45 - 64 years Comparison
Immigrants from Panama
Immigrants from Belgium
$93,815
HOUSEHOLDER INCOME AGES 45 - 64 YEARS
3.7/ 100
METRIC RATING
228th/ 347
METRIC RANK
$118,932
HOUSEHOLDER INCOME AGES 45 - 64 YEARS
100.0/ 100
METRIC RATING
22nd/ 347
METRIC RANK
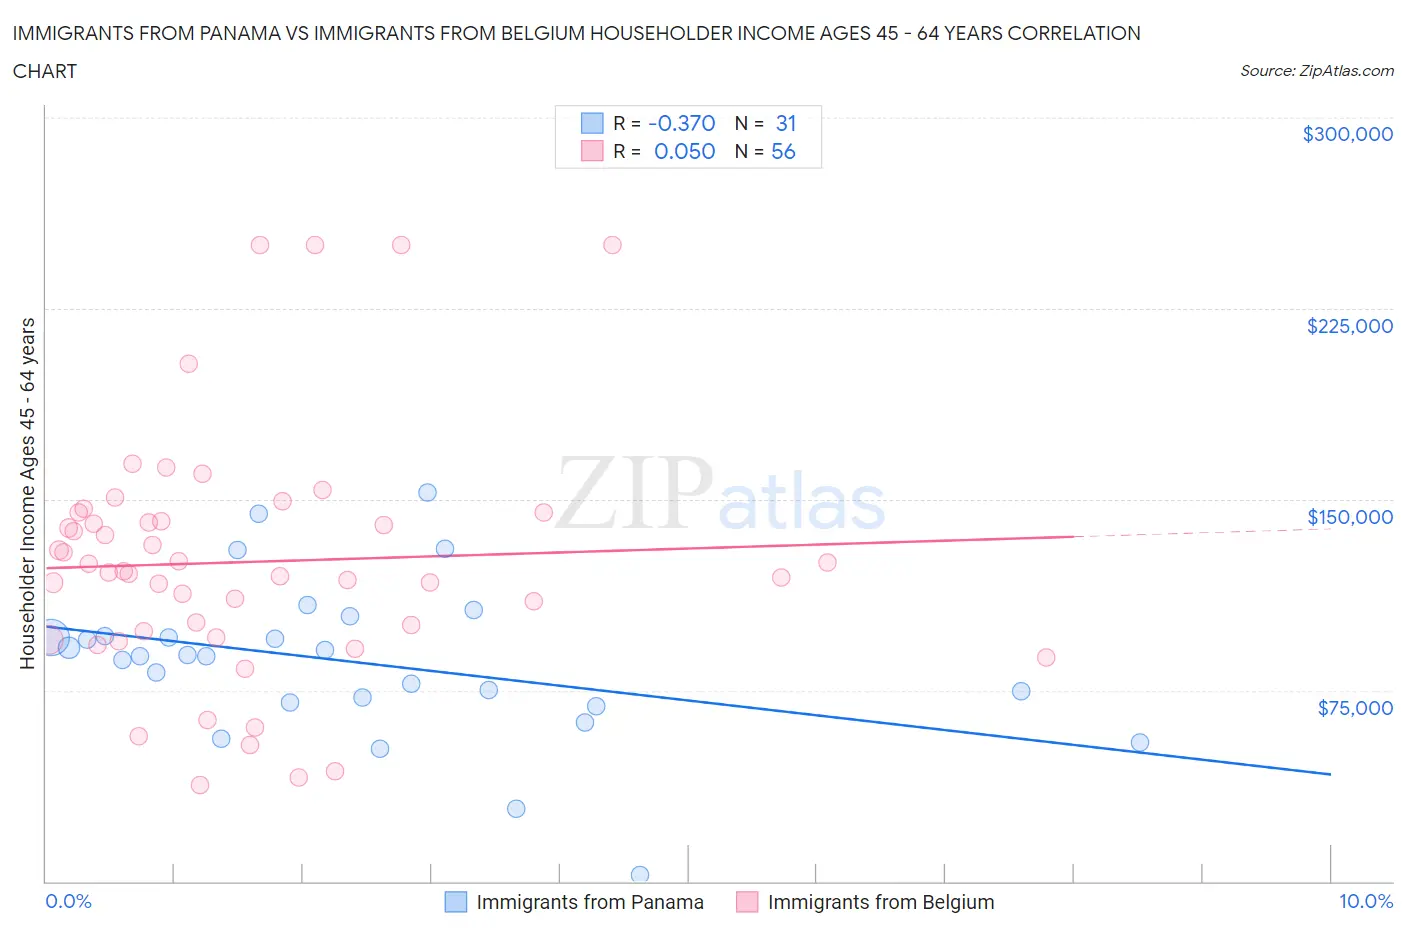
Immigrants from Panama vs Immigrants from Belgium Householder Income Ages 45 - 64 years Correlation Chart
The statistical analysis conducted on geographies consisting of 221,006,827 people shows a mild negative correlation between the proportion of Immigrants from Panama and household income with householder between the ages 45 and 64 in the United States with a correlation coefficient (R) of -0.370 and weighted average of $93,815. Similarly, the statistical analysis conducted on geographies consisting of 146,611,057 people shows a slight positive correlation between the proportion of Immigrants from Belgium and household income with householder between the ages 45 and 64 in the United States with a correlation coefficient (R) of 0.050 and weighted average of $118,932, a difference of 26.8%.
Householder Income Ages 45 - 64 years Correlation Summary
| Measurement | Immigrants from Panama | Immigrants from Belgium |
| Minimum | $2,499 | $38,026 |
| Maximum | $152,844 | $250,001 |
| Range | $150,345 | $211,975 |
| Mean | $86,009 | $125,440 |
| Median | $88,407 | $121,589 |
| Interquartile 25% (IQ1) | $70,337 | $96,886 |
| Interquartile 75% (IQ3) | $96,322 | $142,973 |
| Interquartile Range (IQR) | $25,984 | $46,087 |
| Standard Deviation (Sample) | $30,853 | $48,145 |
| Standard Deviation (Population) | $30,351 | $47,713 |
Similar Demographics by Householder Income Ages 45 - 64 years
Demographics Similar to Immigrants from Panama by Householder Income Ages 45 - 64 years
In terms of householder income ages 45 - 64 years, the demographic groups most similar to Immigrants from Panama are Vietnamese ($93,788, a difference of 0.030%), Immigrants from Sudan ($93,781, a difference of 0.040%), Ecuadorian ($93,739, a difference of 0.080%), Sudanese ($93,718, a difference of 0.10%), and Alaska Native ($93,991, a difference of 0.19%).
| Demographics | Rating | Rank | Householder Income Ages 45 - 64 years |
| Immigrants | Nigeria | 5.9 /100 | #221 | Tragic $94,804 |
| Malaysians | 5.2 /100 | #222 | Tragic $94,517 |
| Immigrants | Nonimmigrants | 5.0 /100 | #223 | Tragic $94,448 |
| Immigrants | Bosnia and Herzegovina | 4.6 /100 | #224 | Tragic $94,288 |
| Bermudans | 4.4 /100 | #225 | Tragic $94,197 |
| Immigrants | Azores | 4.3 /100 | #226 | Tragic $94,138 |
| Alaska Natives | 4.0 /100 | #227 | Tragic $93,991 |
| Immigrants | Panama | 3.7 /100 | #228 | Tragic $93,815 |
| Vietnamese | 3.6 /100 | #229 | Tragic $93,788 |
| Immigrants | Sudan | 3.6 /100 | #230 | Tragic $93,781 |
| Ecuadorians | 3.6 /100 | #231 | Tragic $93,739 |
| Sudanese | 3.5 /100 | #232 | Tragic $93,718 |
| Nepalese | 3.0 /100 | #233 | Tragic $93,355 |
| Immigrants | El Salvador | 2.7 /100 | #234 | Tragic $93,176 |
| Nicaraguans | 2.0 /100 | #235 | Tragic $92,554 |
Demographics Similar to Immigrants from Belgium by Householder Income Ages 45 - 64 years
In terms of householder income ages 45 - 64 years, the demographic groups most similar to Immigrants from Belgium are Bolivian ($118,871, a difference of 0.050%), Immigrants from Sri Lanka ($119,094, a difference of 0.14%), Immigrants from Australia ($119,308, a difference of 0.32%), Immigrants from Japan ($118,498, a difference of 0.37%), and Asian ($118,426, a difference of 0.43%).
| Demographics | Rating | Rank | Householder Income Ages 45 - 64 years |
| Immigrants | Eastern Asia | 100.0 /100 | #15 | Exceptional $122,222 |
| Immigrants | China | 100.0 /100 | #16 | Exceptional $122,178 |
| Burmese | 100.0 /100 | #17 | Exceptional $121,444 |
| Immigrants | Korea | 100.0 /100 | #18 | Exceptional $121,243 |
| Eastern Europeans | 100.0 /100 | #19 | Exceptional $120,684 |
| Immigrants | Australia | 100.0 /100 | #20 | Exceptional $119,308 |
| Immigrants | Sri Lanka | 100.0 /100 | #21 | Exceptional $119,094 |
| Immigrants | Belgium | 100.0 /100 | #22 | Exceptional $118,932 |
| Bolivians | 100.0 /100 | #23 | Exceptional $118,871 |
| Immigrants | Japan | 100.0 /100 | #24 | Exceptional $118,498 |
| Asians | 100.0 /100 | #25 | Exceptional $118,426 |
| Immigrants | Sweden | 100.0 /100 | #26 | Exceptional $118,318 |
| Immigrants | Northern Europe | 100.0 /100 | #27 | Exceptional $117,930 |
| Turks | 100.0 /100 | #28 | Exceptional $117,814 |
| Bhutanese | 100.0 /100 | #29 | Exceptional $117,750 |