Immigrants from Panama vs Hungarian Median Household Income
COMPARE
Immigrants from Panama
Hungarian
Median Household Income
Median Household Income Comparison
Immigrants from Panama
Hungarians
$80,873
MEDIAN HOUSEHOLD INCOME
6.2/ 100
METRIC RATING
226th/ 347
METRIC RANK
$86,920
MEDIAN HOUSEHOLD INCOME
76.3/ 100
METRIC RATING
151st/ 347
METRIC RANK
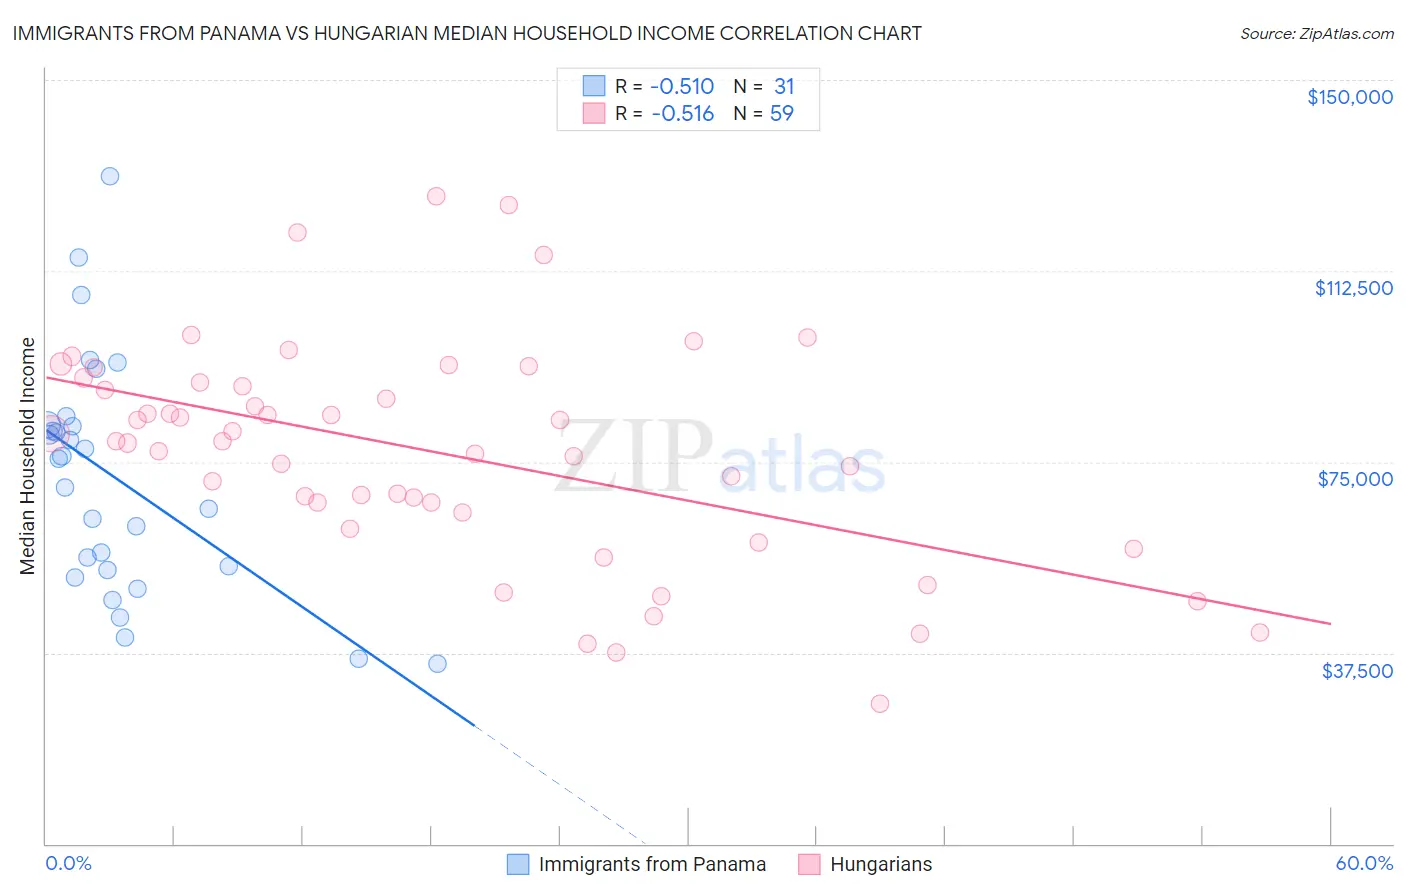
Immigrants from Panama vs Hungarian Median Household Income Correlation Chart
The statistical analysis conducted on geographies consisting of 221,141,293 people shows a substantial negative correlation between the proportion of Immigrants from Panama and median household income in the United States with a correlation coefficient (R) of -0.510 and weighted average of $80,873. Similarly, the statistical analysis conducted on geographies consisting of 485,741,386 people shows a substantial negative correlation between the proportion of Hungarians and median household income in the United States with a correlation coefficient (R) of -0.516 and weighted average of $86,920, a difference of 7.5%.
Median Household Income Correlation Summary
| Measurement | Immigrants from Panama | Hungarian |
| Minimum | $35,430 | $27,488 |
| Maximum | $130,979 | $127,161 |
| Range | $95,549 | $99,673 |
| Mean | $71,805 | $76,828 |
| Median | $75,655 | $79,103 |
| Interquartile 25% (IQ1) | $53,712 | $65,060 |
| Interquartile 75% (IQ3) | $82,267 | $90,559 |
| Interquartile Range (IQR) | $28,555 | $25,499 |
| Standard Deviation (Sample) | $23,036 | $21,600 |
| Standard Deviation (Population) | $22,661 | $21,417 |
Similar Demographics by Median Household Income
Demographics Similar to Immigrants from Panama by Median Household Income
In terms of median household income, the demographic groups most similar to Immigrants from Panama are Scotch-Irish ($80,972, a difference of 0.12%), Guyanese ($80,734, a difference of 0.17%), Immigrants from Bangladesh ($80,722, a difference of 0.19%), Malaysian ($81,064, a difference of 0.24%), and Immigrants from El Salvador ($81,213, a difference of 0.42%).
| Demographics | Rating | Rank | Median Household Income |
| Nigerians | 10.3 /100 | #219 | Poor $81,725 |
| Immigrants | Venezuela | 9.0 /100 | #220 | Tragic $81,506 |
| Immigrants | Ghana | 9.0 /100 | #221 | Tragic $81,489 |
| Immigrants | Nigeria | 7.7 /100 | #222 | Tragic $81,236 |
| Immigrants | El Salvador | 7.6 /100 | #223 | Tragic $81,213 |
| Malaysians | 7.0 /100 | #224 | Tragic $81,064 |
| Scotch-Irish | 6.6 /100 | #225 | Tragic $80,972 |
| Immigrants | Panama | 6.2 /100 | #226 | Tragic $80,873 |
| Guyanese | 5.7 /100 | #227 | Tragic $80,734 |
| Immigrants | Bangladesh | 5.7 /100 | #228 | Tragic $80,722 |
| Delaware | 5.0 /100 | #229 | Tragic $80,527 |
| Bermudans | 4.7 /100 | #230 | Tragic $80,406 |
| Trinidadians and Tobagonians | 4.7 /100 | #231 | Tragic $80,402 |
| Immigrants | Trinidad and Tobago | 4.6 /100 | #232 | Tragic $80,373 |
| Immigrants | Azores | 4.5 /100 | #233 | Tragic $80,357 |
Demographics Similar to Hungarians by Median Household Income
In terms of median household income, the demographic groups most similar to Hungarians are Immigrants from Saudi Arabia ($86,875, a difference of 0.050%), Basque ($87,001, a difference of 0.090%), South American ($86,824, a difference of 0.11%), Immigrants from Nepal ($87,046, a difference of 0.15%), and Immigrants from Germany ($86,764, a difference of 0.18%).
| Demographics | Rating | Rank | Median Household Income |
| Serbians | 83.0 /100 | #144 | Excellent $87,572 |
| Ugandans | 82.9 /100 | #145 | Excellent $87,557 |
| Immigrants | Uganda | 82.8 /100 | #146 | Excellent $87,553 |
| South American Indians | 81.8 /100 | #147 | Excellent $87,446 |
| Costa Ricans | 80.0 /100 | #148 | Excellent $87,262 |
| Immigrants | Nepal | 77.7 /100 | #149 | Good $87,046 |
| Basques | 77.2 /100 | #150 | Good $87,001 |
| Hungarians | 76.3 /100 | #151 | Good $86,920 |
| Immigrants | Saudi Arabia | 75.8 /100 | #152 | Good $86,875 |
| South Americans | 75.1 /100 | #153 | Good $86,824 |
| Immigrants | Germany | 74.4 /100 | #154 | Good $86,764 |
| Carpatho Rusyns | 72.8 /100 | #155 | Good $86,635 |
| Immigrants | Albania | 71.5 /100 | #156 | Good $86,534 |
| Samoans | 71.0 /100 | #157 | Good $86,498 |
| Moroccans | 70.6 /100 | #158 | Good $86,468 |