Immigrants from Nigeria vs Immigrants from Bahamas Householder Income Ages 25 - 44 years
COMPARE
Immigrants from Nigeria
Immigrants from Bahamas
Householder Income Ages 25 - 44 years
Householder Income Ages 25 - 44 years Comparison
Immigrants from Nigeria
Immigrants from Bahamas
$86,589
HOUSEHOLDER INCOME AGES 25 - 44 YEARS
1.2/ 100
METRIC RATING
247th/ 347
METRIC RANK
$76,910
HOUSEHOLDER INCOME AGES 25 - 44 YEARS
0.0/ 100
METRIC RATING
327th/ 347
METRIC RANK
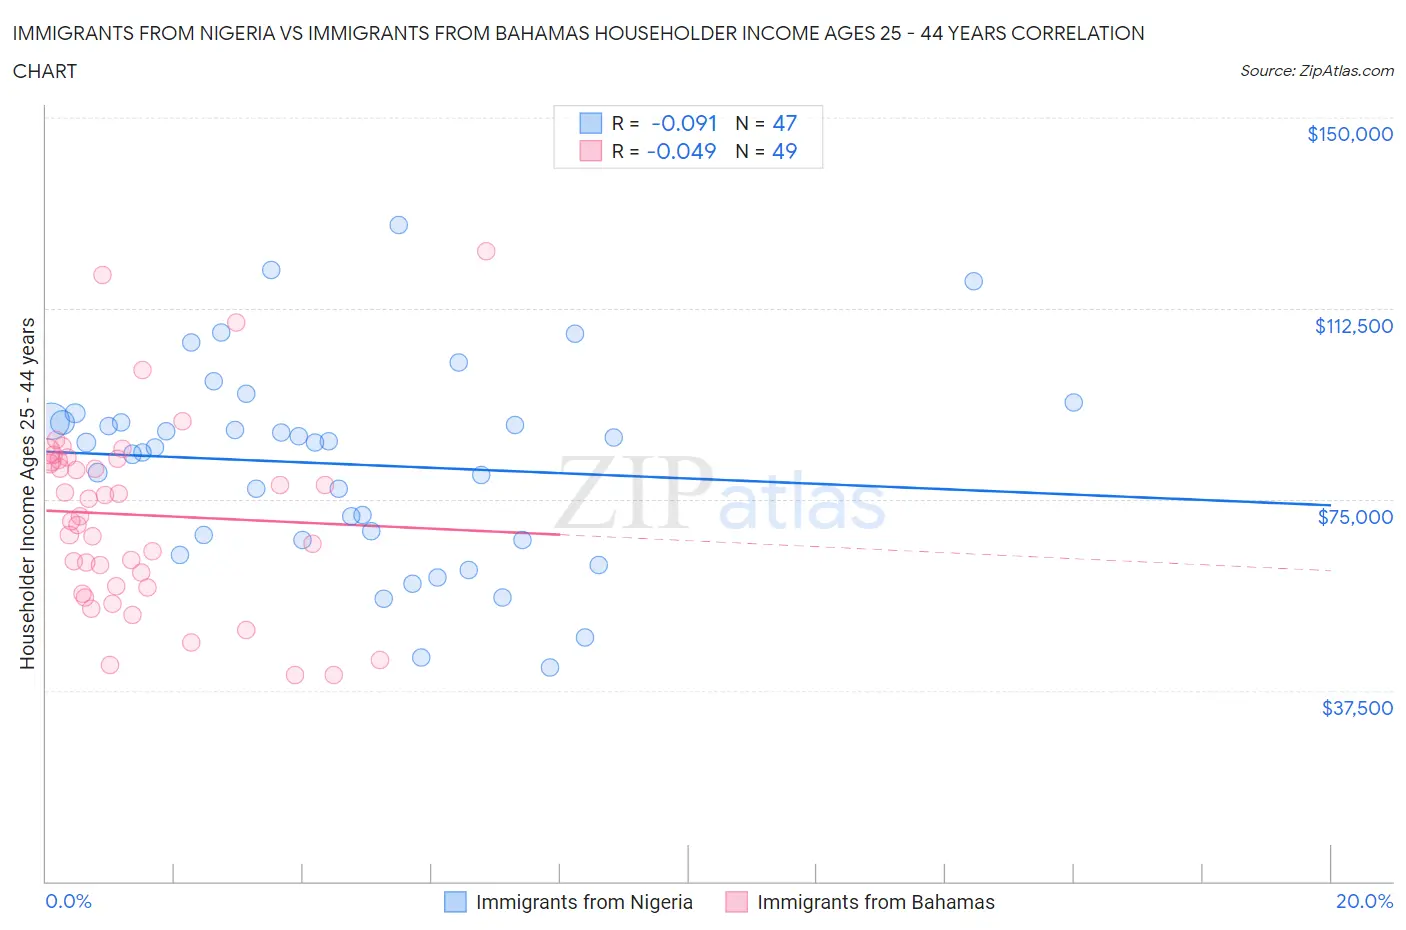
Immigrants from Nigeria vs Immigrants from Bahamas Householder Income Ages 25 - 44 years Correlation Chart
The statistical analysis conducted on geographies consisting of 283,094,597 people shows a slight negative correlation between the proportion of Immigrants from Nigeria and household income with householder between the ages 25 and 44 in the United States with a correlation coefficient (R) of -0.091 and weighted average of $86,589. Similarly, the statistical analysis conducted on geographies consisting of 104,540,789 people shows no correlation between the proportion of Immigrants from Bahamas and household income with householder between the ages 25 and 44 in the United States with a correlation coefficient (R) of -0.049 and weighted average of $76,910, a difference of 12.6%.
Householder Income Ages 25 - 44 years Correlation Summary
| Measurement | Immigrants from Nigeria | Immigrants from Bahamas |
| Minimum | $42,092 | $40,456 |
| Maximum | $128,882 | $123,699 |
| Range | $86,790 | $83,243 |
| Mean | $81,924 | $71,953 |
| Median | $86,086 | $71,583 |
| Interquartile 25% (IQ1) | $67,086 | $57,810 |
| Interquartile 75% (IQ3) | $90,392 | $82,867 |
| Interquartile Range (IQR) | $23,305 | $25,057 |
| Standard Deviation (Sample) | $19,417 | $18,615 |
| Standard Deviation (Population) | $19,209 | $18,424 |
Similar Demographics by Householder Income Ages 25 - 44 years
Demographics Similar to Immigrants from Nigeria by Householder Income Ages 25 - 44 years
In terms of householder income ages 25 - 44 years, the demographic groups most similar to Immigrants from Nigeria are Immigrants from Burma/Myanmar ($86,736, a difference of 0.17%), Immigrants from El Salvador ($86,913, a difference of 0.37%), Immigrants from Venezuela ($87,038, a difference of 0.52%), Immigrants from West Indies ($87,063, a difference of 0.55%), and Immigrants from Sudan ($86,109, a difference of 0.56%).
| Demographics | Rating | Rank | Householder Income Ages 25 - 44 years |
| Nicaraguans | 2.2 /100 | #240 | Tragic $87,751 |
| Nigerians | 2.2 /100 | #241 | Tragic $87,730 |
| West Indians | 1.7 /100 | #242 | Tragic $87,205 |
| Immigrants | West Indies | 1.5 /100 | #243 | Tragic $87,063 |
| Immigrants | Venezuela | 1.5 /100 | #244 | Tragic $87,038 |
| Immigrants | El Salvador | 1.4 /100 | #245 | Tragic $86,913 |
| Immigrants | Burma/Myanmar | 1.3 /100 | #246 | Tragic $86,736 |
| Immigrants | Nigeria | 1.2 /100 | #247 | Tragic $86,589 |
| Immigrants | Sudan | 0.9 /100 | #248 | Tragic $86,109 |
| French American Indians | 0.8 /100 | #249 | Tragic $85,899 |
| Pennsylvania Germans | 0.8 /100 | #250 | Tragic $85,836 |
| Cape Verdeans | 0.8 /100 | #251 | Tragic $85,758 |
| Immigrants | Western Africa | 0.7 /100 | #252 | Tragic $85,676 |
| British West Indians | 0.7 /100 | #253 | Tragic $85,565 |
| Immigrants | Laos | 0.7 /100 | #254 | Tragic $85,553 |
Demographics Similar to Immigrants from Bahamas by Householder Income Ages 25 - 44 years
In terms of householder income ages 25 - 44 years, the demographic groups most similar to Immigrants from Bahamas are Houma ($77,044, a difference of 0.17%), Sioux ($77,089, a difference of 0.23%), Immigrants from Cuba ($76,701, a difference of 0.27%), Seminole ($76,584, a difference of 0.42%), and Dutch West Indian ($77,260, a difference of 0.46%).
| Demographics | Rating | Rank | Householder Income Ages 25 - 44 years |
| Choctaw | 0.0 /100 | #320 | Tragic $78,168 |
| Immigrants | Zaire | 0.0 /100 | #321 | Tragic $78,045 |
| Chickasaw | 0.0 /100 | #322 | Tragic $77,929 |
| Immigrants | Honduras | 0.0 /100 | #323 | Tragic $77,328 |
| Dutch West Indians | 0.0 /100 | #324 | Tragic $77,260 |
| Sioux | 0.0 /100 | #325 | Tragic $77,089 |
| Houma | 0.0 /100 | #326 | Tragic $77,044 |
| Immigrants | Bahamas | 0.0 /100 | #327 | Tragic $76,910 |
| Immigrants | Cuba | 0.0 /100 | #328 | Tragic $76,701 |
| Seminole | 0.0 /100 | #329 | Tragic $76,584 |
| Yakama | 0.0 /100 | #330 | Tragic $76,226 |
| Natives/Alaskans | 0.0 /100 | #331 | Tragic $75,647 |
| Bahamians | 0.0 /100 | #332 | Tragic $75,395 |
| Hopi | 0.0 /100 | #333 | Tragic $75,002 |
| Creek | 0.0 /100 | #334 | Tragic $74,847 |