Immigrants from Netherlands vs Central American Indian Householder Income Over 65 years

COMPARE

Immigrants from Netherlands
Race
Ancestry
AfghanAfricanAlaska NativeAlaskan AthabascanAlbanianAleutAlsatianAmericanApacheArabArapahoArgentineanArmenianAssyrian/Chaldean/SyriacAustralianAustrianBahamianBangladeshiBarbadianBasqueBelgianBelizeanBermudanBhutaneseBlackfeetBolivianBrazilianBritishBritish West IndianBulgarianBurmeseCajunCambodianCanadianCape VerdeanCarpatho RusynCelticCentral AmericanCherokeeCheyenneChickasawChileanChineseChippewaChoctawColombianColvilleComancheCosta RicanCreeCreekCroatianCrowCubanCypriotCzechCzechoslovakianDanishDelawareDominicanDutchDutch West IndianEastern EuropeanEcuadorianEgyptianEnglishEstonianEthiopianEuropeanFijianFilipinoFinnishFrenchFrench American IndianFrench CanadianGermanGerman RussianGhanaianGreekGuamanian/ChamorroGuatemalanGuyaneseHaitianHmongHonduranHopiHoumaHungarianIcelanderIndian (Asian)IndonesianInupiatIranianIraqiIrishIroquoisIsraeliItalianJamaicanJapaneseJordanianKenyanKiowaKoreanLaotianLatvianLebaneseLiberianLithuanianLumbeeLuxembourgerMacedonianMalaysianMalteseMarshalleseMenomineeMexicanMexican American IndianMongolianMoroccanNative HawaiianNavajoNepaleseNew ZealanderNicaraguanNigerianNorthern EuropeanNorwegianOkinawanOsageOttawaPaiutePakistaniPalestinianPanamanianParaguayanPennsylvania GermanPeruvianPimaPolishPortuguesePotawatomiPuebloPuerto RicanPuget Sound SalishRomanianRussianSalvadoranSamoanScandinavianScotch-IrishScottishSeminoleSenegaleseSerbianShoshoneSierra LeoneanSiouxSlavicSlovakSloveneSomaliSouth AfricanSouth AmericanSouth American IndianSoviet UnionSpaniardSpanishSpanish AmericanSpanish American IndianSri LankanSubsaharan AfricanSudaneseSwedishSwissSyrianTaiwaneseThaiTlingit-HaidaTohono O'OdhamTonganTrinidadian and TobagonianTsimshianTurkishU.S. Virgin IslanderUgandanUkrainianUruguayanUteVenezuelanVietnameseWelshWest IndianYakamaYaquiYugoslavianYumanYup'ikZimbabwean
Immigration
NonimmigrantsImmigrantsAfghanistanAfricaAlbaniaArgentinaArmeniaAsiaAustraliaAustriaBahamasBangladeshBarbadosBelarusBelgiumBelizeBoliviaBosnia and HerzegovinaBrazilBulgariaBurma/MyanmarCabo VerdeCambodiaCameroonCanadaCaribbeanCentral AmericaChileChinaColombiaCongoCosta RicaCroatiaCubaCzechoslovakiaDenmarkDominicaDominican RepublicEastern AfricaEastern AsiaEastern EuropeEcuadorEgyptEl SalvadorEnglandEritreaEthiopiaEuropeFijiFranceGermanyGhanaGreeceGrenadaGuatemalaGuyanaHaitiHondurasHong KongHungaryIndiaIndonesiaIranIraqIrelandIsraelItalyJamaicaJapanJordanKazakhstanKenyaKoreaKuwaitLaosLatin AmericaLatviaLebanonLiberiaLithuaniaMalaysiaMexicoMicronesiaMiddle AfricaMoldovaMoroccoNepalNetherlandsNicaraguaNigeriaNorth AmericaNorth MacedoniaNorthern AfricaNorthern EuropeNorwayOceaniaPakistanPanamaPeruPhilippinesPolandPortugalRomaniaRussiaSaudi ArabiaScotlandSenegalSerbiaSierra LeoneSingaporeSomaliaSouth AfricaSouth AmericaSouth Central AsiaSouth Eastern AsiaSouthern EuropeSpainSri LankaSt. Vincent and the GrenadinesSudanSwedenSwitzerlandSyriaTaiwanThailandTrinidad and TobagoTurkeyUgandaUkraineUruguayUzbekistanVenezuelaVietnamWest IndiesWestern AfricaWestern AsiaWestern EuropeYemenZaireZimbabweAzores
Central American Indian
Race
Ancestry
AfghanAfricanAlaska NativeAlaskan AthabascanAlbanianAleutAlsatianAmericanApacheArabArapahoArgentineanArmenianAssyrian/Chaldean/SyriacAustralianAustrianBahamianBangladeshiBarbadianBasqueBelgianBelizeanBermudanBhutaneseBlackfeetBolivianBrazilianBritishBritish West IndianBulgarianBurmeseCajunCambodianCanadianCape VerdeanCarpatho RusynCelticCentral AmericanCentral American IndianCherokeeCheyenneChickasawChileanChineseChippewaChoctawColombianColvilleComancheCosta RicanCreeCreekCroatianCrowCubanCypriotCzechCzechoslovakianDanishDelawareDominicanDutchDutch West IndianEastern EuropeanEcuadorianEgyptianEnglishEstonianEthiopianEuropeanFijianFilipinoFinnishFrenchFrench American IndianFrench CanadianGermanGerman RussianGhanaianGreekGuamanian/ChamorroGuatemalanGuyaneseHaitianHmongHonduranHopiHoumaHungarianIcelanderIndian (Asian)IndonesianInupiatIranianIraqiIrishIroquoisIsraeliItalianJamaicanJapaneseJordanianKenyanKiowaKoreanLaotianLatvianLebaneseLiberianLithuanianLumbeeLuxembourgerMacedonianMalaysianMalteseMarshalleseMenomineeMexicanMexican American IndianMongolianMoroccanNative HawaiianNavajoNepaleseNew ZealanderNicaraguanNigerianNorthern EuropeanNorwegianOkinawanOsageOttawaPaiutePakistaniPalestinianPanamanianParaguayanPennsylvania GermanPeruvianPimaPolishPortuguesePotawatomiPuebloPuerto RicanPuget Sound SalishRomanianRussianSalvadoranSamoanScandinavianScotch-IrishScottishSeminoleSenegaleseSerbianShoshoneSierra LeoneanSiouxSlavicSlovakSloveneSomaliSouth AfricanSouth AmericanSouth American IndianSoviet UnionSpaniardSpanishSpanish AmericanSpanish American IndianSri LankanSubsaharan AfricanSudaneseSwedishSwissSyrianTaiwaneseThaiTlingit-HaidaTohono O'OdhamTonganTrinidadian and TobagonianTsimshianTurkishU.S. Virgin IslanderUgandanUkrainianUruguayanUteVenezuelanVietnameseWelshWest IndianYakamaYaquiYugoslavianYumanYup'ikZimbabwean
Immigration
NonimmigrantsImmigrantsAfghanistanAfricaAlbaniaArgentinaArmeniaAsiaAustraliaAustriaBahamasBangladeshBarbadosBelarusBelgiumBelizeBoliviaBosnia and HerzegovinaBrazilBulgariaBurma/MyanmarCabo VerdeCambodiaCameroonCanadaCaribbeanCentral AmericaChileChinaColombiaCongoCosta RicaCroatiaCubaCzechoslovakiaDenmarkDominicaDominican RepublicEastern AfricaEastern AsiaEastern EuropeEcuadorEgyptEl SalvadorEnglandEritreaEthiopiaEuropeFijiFranceGermanyGhanaGreeceGrenadaGuatemalaGuyanaHaitiHondurasHong KongHungaryIndiaIndonesiaIranIraqIrelandIsraelItalyJamaicaJapanJordanKazakhstanKenyaKoreaKuwaitLaosLatin AmericaLatviaLebanonLiberiaLithuaniaMalaysiaMexicoMicronesiaMiddle AfricaMoldovaMoroccoNepalNicaraguaNigeriaNorth AmericaNorth MacedoniaNorthern AfricaNorthern EuropeNorwayOceaniaPakistanPanamaPeruPhilippinesPolandPortugalRomaniaRussiaSaudi ArabiaScotlandSenegalSerbiaSierra LeoneSingaporeSomaliaSouth AfricaSouth AmericaSouth Central AsiaSouth Eastern AsiaSouthern EuropeSpainSri LankaSt. Vincent and the GrenadinesSudanSwedenSwitzerlandSyriaTaiwanThailandTrinidad and TobagoTurkeyUgandaUkraineUruguayUzbekistanVenezuelaVietnamWest IndiesWestern AfricaWestern AsiaWestern EuropeYemenZaireZimbabweAzores
Householder Income Over 65 years
Income
Poverty
Unemployment
Labor Participation
Family Structure
Vehicle Availability
Education Level
Disability

Householder Income Over 65 years Comparison

Immigrants from Netherlands

Central American Indians

Exceptional
Tragic
$66,463
HOUSEHOLDER INCOME OVER 65 YEARS
99.7/ 100
METRIC RATING
54th/ 347
METRIC RANK
$53,232
HOUSEHOLDER INCOME OVER 65 YEARS
0.0/ 100
METRIC RATING
298th/ 347
METRIC RANK

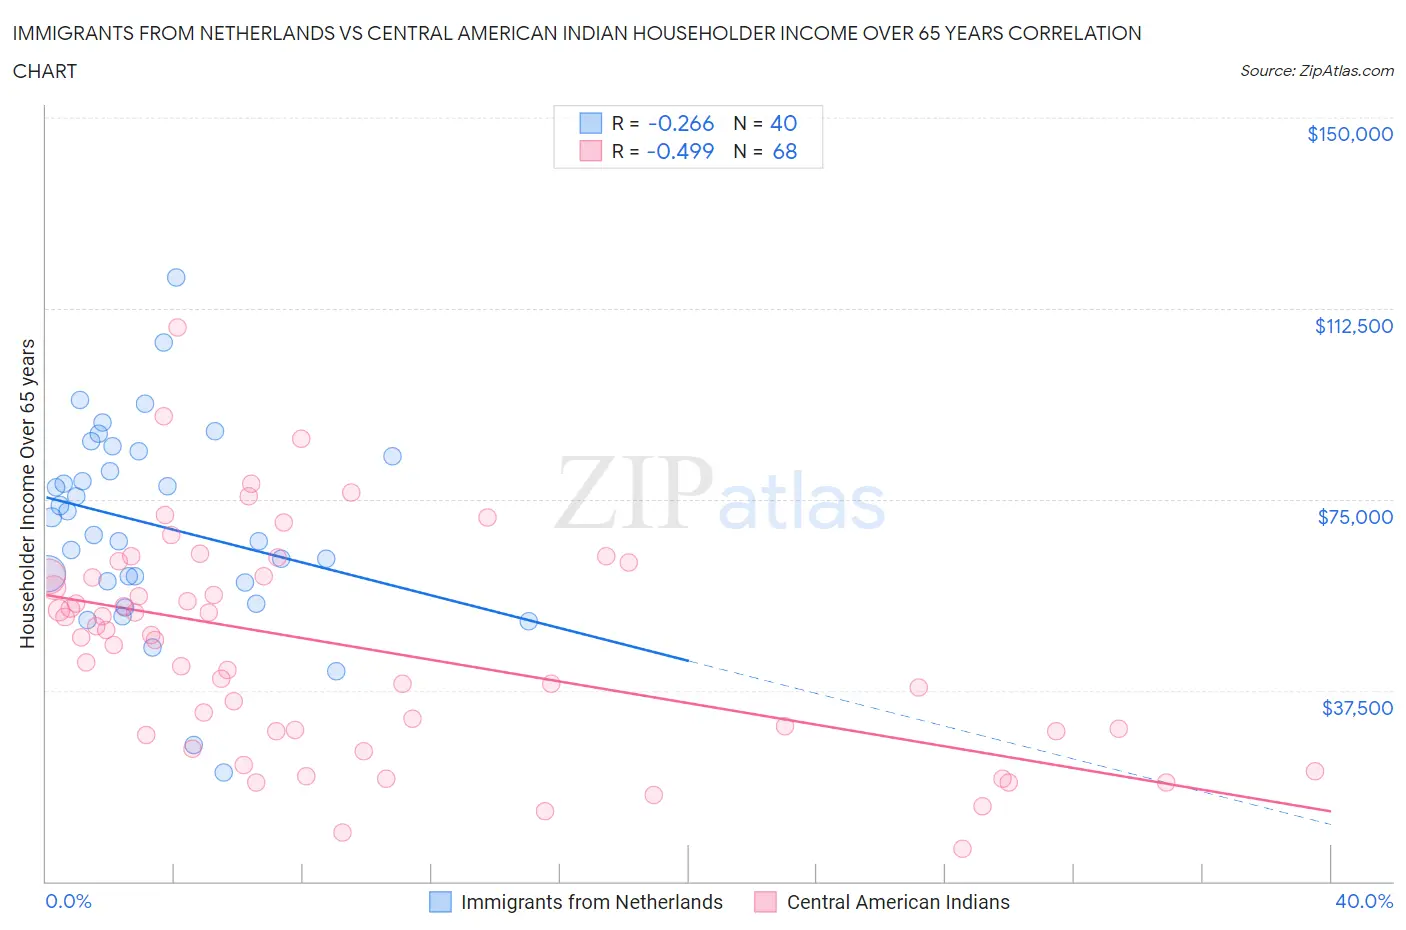
Immigrants from Netherlands vs Central American Indian Householder Income Over 65 years Correlation Chart

The statistical analysis conducted on geographies consisting of 237,577,957 people shows a weak negative correlation between the proportion of Immigrants from Netherlands and household income with householder over the age of 65 in the United States with a correlation coefficient (R) of -0.266 and weighted average of $66,463. Similarly, the statistical analysis conducted on geographies consisting of 325,252,535 people shows a moderate negative correlation between the proportion of Central American Indians and household income with householder over the age of 65 in the United States with a correlation coefficient (R) of -0.499 and weighted average of $53,232, a difference of 24.9%.
Immigrants from Netherlands vs Central American Indian Householder Income Over 65 years

Householder Income Over 65 years Correlation Summary

MeasurementImmigrants from NetherlandsCentral American Indian
Minimum$21,380$6,451
Maximum$118,574$108,875
Range$97,194$102,424
Mean$69,853$46,111
Median$69,767$48,148
Interquartile 25% (IQ1)$58,822$29,434
Interquartile 75% (IQ3)$83,878$59,835
Interquartile Range (IQR)$25,055$30,401
Standard Deviation (Sample)$19,636$21,274
Standard Deviation (Population)$19,389$21,117

Similar Demographics by Householder Income Over 65 years

Demographics Similar to Immigrants from Netherlands by Householder Income Over 65 years

In terms of householder income over 65 years, the demographic groups most similar to Immigrants from Netherlands are Immigrants from Czechoslovakia ($66,376, a difference of 0.13%), Immigrants from Pakistan ($66,617, a difference of 0.23%), Immigrants from Scotland ($66,620, a difference of 0.24%), Laotian ($66,306, a difference of 0.24%), and Israeli ($66,636, a difference of 0.26%).
DemographicsRating | RankHouseholder Income Over 65 years
Australians
99.8
/100
|
#47
Exceptional
$66,891
Immigrants | France
99.8
/100
|
#48
Exceptional
$66,826
Immigrants | Indonesia
99.8
/100
|
#49
Exceptional
$66,694
Immigrants | Turkey
99.7
/100
|
#50
Exceptional
$66,672
Israelis
99.7
/100
|
#51
Exceptional
$66,636
Immigrants | Scotland
99.7
/100
|
#52
Exceptional
$66,620
Immigrants | Pakistan
99.7
/100
|
#53
Exceptional
$66,617
Immigrants | Netherlands
99.7
/100
|
#54
Exceptional
$66,463
Immigrants | Czechoslovakia
99.7
/100
|
#55
Exceptional
$66,376
Laotians
99.6
/100
|
#56
Exceptional
$66,306
Bulgarians
99.6
/100
|
#57
Exceptional
$66,236
Immigrants | Philippines
99.6
/100
|
#58
Exceptional
$66,161
Immigrants | Norway
99.5
/100
|
#59
Exceptional
$66,118
Immigrants | Lithuania
99.5
/100
|
#60
Exceptional
$66,087
Maltese
99.5
/100
|
#61
Exceptional
$66,027

Demographics Similar to Central American Indians by Householder Income Over 65 years

In terms of householder income over 65 years, the demographic groups most similar to Central American Indians are Ottawa ($53,217, a difference of 0.030%), Immigrants from Latin America ($53,265, a difference of 0.060%), Immigrants from Bahamas ($53,174, a difference of 0.11%), Immigrants from Somalia ($53,333, a difference of 0.19%), and Yuman ($53,110, a difference of 0.23%).
DemographicsRating | RankHouseholder Income Over 65 years
Africans
0.0
/100
|
#291
Tragic
$53,711
Shoshone
0.0
/100
|
#292
Tragic
$53,681
Immigrants | Belize
0.0
/100
|
#293
Tragic
$53,665
Senegalese
0.0
/100
|
#294
Tragic
$53,591
Immigrants | Central America
0.0
/100
|
#295
Tragic
$53,420
Immigrants | Somalia
0.0
/100
|
#296
Tragic
$53,333
Immigrants | Latin America
0.0
/100
|
#297
Tragic
$53,265
Central American Indians
0.0
/100
|
#298
Tragic
$53,232
Ottawa
0.0
/100
|
#299
Tragic
$53,217
Immigrants | Bahamas
0.0
/100
|
#300
Tragic
$53,174
Yuman
0.0
/100
|
#301
Tragic
$53,110
Spanish American Indians
0.0
/100
|
#302
Tragic
$53,077
Choctaw
0.0
/100
|
#303
Tragic
$53,060
Ute
0.0
/100
|
#304
Tragic
$52,949
Pueblo
0.0
/100
|
#305
Tragic
$52,930