Immigrants from Morocco vs British West Indian Median Male Earnings
COMPARE
Immigrants from Morocco
British West Indian
Median Male Earnings
Median Male Earnings Comparison
Immigrants from Morocco
British West Indians
$56,958
MEDIAN MALE EARNINGS
91.8/ 100
METRIC RATING
125th/ 347
METRIC RANK
$49,636
MEDIAN MALE EARNINGS
0.8/ 100
METRIC RATING
257th/ 347
METRIC RANK
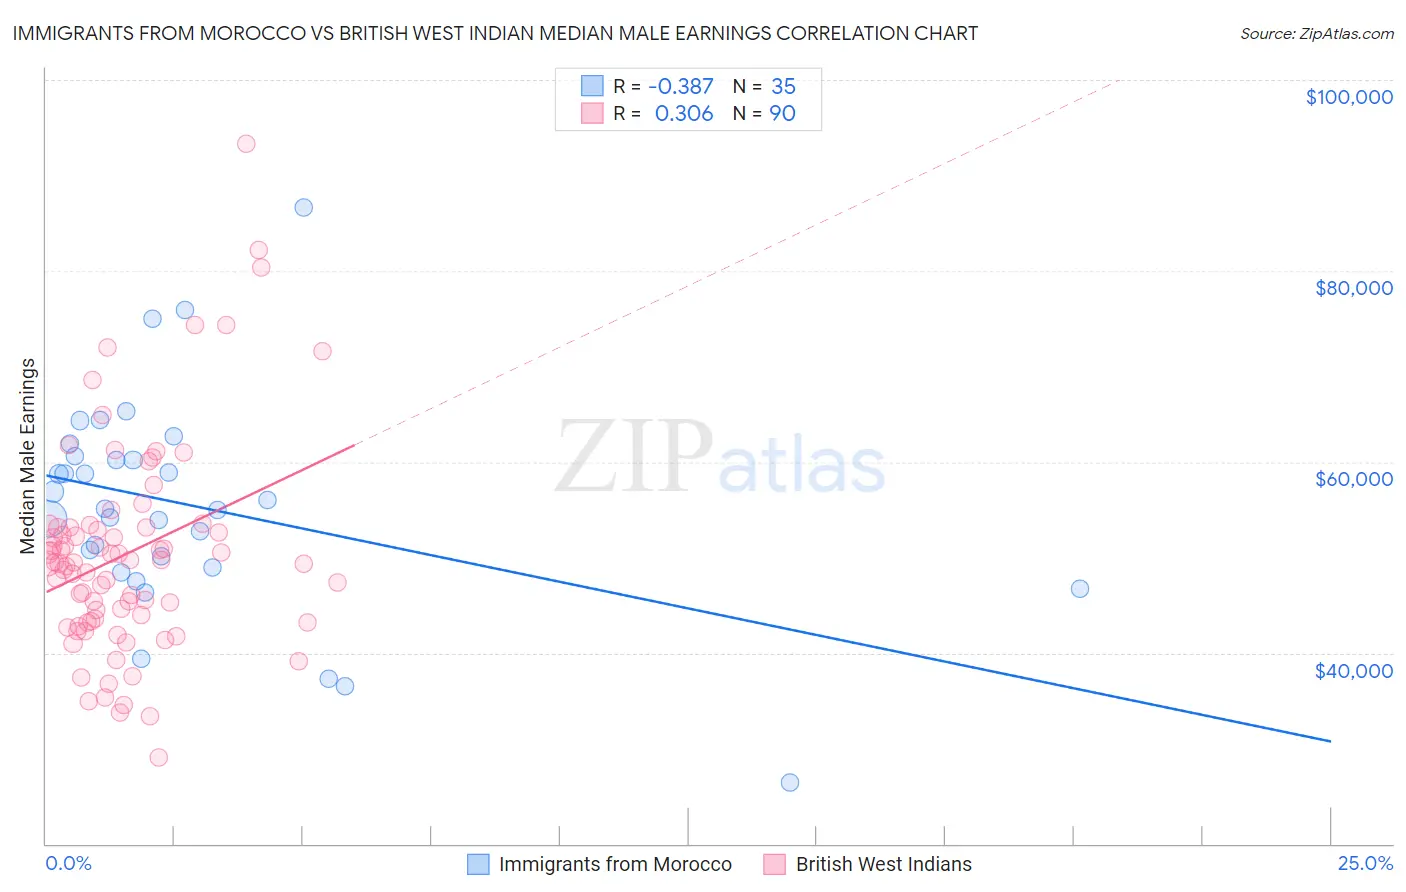
Immigrants from Morocco vs British West Indian Median Male Earnings Correlation Chart
The statistical analysis conducted on geographies consisting of 178,898,918 people shows a mild negative correlation between the proportion of Immigrants from Morocco and median male earnings in the United States with a correlation coefficient (R) of -0.387 and weighted average of $56,958. Similarly, the statistical analysis conducted on geographies consisting of 152,683,188 people shows a mild positive correlation between the proportion of British West Indians and median male earnings in the United States with a correlation coefficient (R) of 0.306 and weighted average of $49,636, a difference of 14.7%.
Median Male Earnings Correlation Summary
| Measurement | Immigrants from Morocco | British West Indian |
| Minimum | $26,429 | $28,979 |
| Maximum | $86,602 | $93,333 |
| Range | $60,173 | $64,354 |
| Mean | $55,429 | $50,358 |
| Median | $55,129 | $49,413 |
| Interquartile 25% (IQ1) | $49,000 | $43,337 |
| Interquartile 75% (IQ3) | $60,575 | $53,079 |
| Interquartile Range (IQR) | $11,575 | $9,742 |
| Standard Deviation (Sample) | $11,412 | $11,060 |
| Standard Deviation (Population) | $11,248 | $10,999 |
Similar Demographics by Median Male Earnings
Demographics Similar to Immigrants from Morocco by Median Male Earnings
In terms of median male earnings, the demographic groups most similar to Immigrants from Morocco are Chilean ($56,973, a difference of 0.030%), Chinese ($56,872, a difference of 0.15%), Brazilian ($56,837, a difference of 0.21%), Immigrants from Syria ($56,830, a difference of 0.23%), and Immigrants from Jordan ($57,145, a difference of 0.33%).
| Demographics | Rating | Rank | Median Male Earnings |
| Hungarians | 94.0 /100 | #118 | Exceptional $57,309 |
| Arabs | 94.0 /100 | #119 | Exceptional $57,298 |
| Canadians | 93.9 /100 | #120 | Exceptional $57,286 |
| Immigrants | Albania | 93.3 /100 | #121 | Exceptional $57,179 |
| Immigrants | Jordan | 93.1 /100 | #122 | Exceptional $57,145 |
| Slovenes | 93.1 /100 | #123 | Exceptional $57,145 |
| Chileans | 91.9 /100 | #124 | Exceptional $56,973 |
| Immigrants | Morocco | 91.8 /100 | #125 | Exceptional $56,958 |
| Chinese | 91.1 /100 | #126 | Exceptional $56,872 |
| Brazilians | 90.9 /100 | #127 | Exceptional $56,837 |
| Immigrants | Syria | 90.8 /100 | #128 | Exceptional $56,830 |
| Pakistanis | 89.9 /100 | #129 | Excellent $56,719 |
| Koreans | 89.4 /100 | #130 | Excellent $56,672 |
| Portuguese | 89.4 /100 | #131 | Excellent $56,663 |
| Czechs | 88.2 /100 | #132 | Excellent $56,546 |
Demographics Similar to British West Indians by Median Male Earnings
In terms of median male earnings, the demographic groups most similar to British West Indians are Alaska Native ($49,711, a difference of 0.15%), Alaskan Athabascan ($49,748, a difference of 0.23%), Senegalese ($49,774, a difference of 0.28%), Cree ($49,497, a difference of 0.28%), and Nepalese ($49,458, a difference of 0.36%).
| Demographics | Rating | Rank | Median Male Earnings |
| Osage | 1.6 /100 | #250 | Tragic $50,292 |
| Immigrants | Grenada | 1.6 /100 | #251 | Tragic $50,279 |
| Immigrants | Cabo Verde | 1.2 /100 | #252 | Tragic $50,009 |
| German Russians | 1.1 /100 | #253 | Tragic $49,924 |
| Senegalese | 1.0 /100 | #254 | Tragic $49,774 |
| Alaskan Athabascans | 0.9 /100 | #255 | Tragic $49,748 |
| Alaska Natives | 0.9 /100 | #256 | Tragic $49,711 |
| British West Indians | 0.8 /100 | #257 | Tragic $49,636 |
| Cree | 0.7 /100 | #258 | Tragic $49,497 |
| Nepalese | 0.7 /100 | #259 | Tragic $49,458 |
| Iroquois | 0.7 /100 | #260 | Tragic $49,374 |
| Liberians | 0.6 /100 | #261 | Tragic $49,318 |
| Immigrants | West Indies | 0.6 /100 | #262 | Tragic $49,271 |
| Nicaraguans | 0.6 /100 | #263 | Tragic $49,215 |
| Immigrants | Middle Africa | 0.6 /100 | #264 | Tragic $49,201 |