Immigrants from Moldova vs Ethiopian Median Household Income
COMPARE
Immigrants from Moldova
Ethiopian
Median Household Income
Median Household Income Comparison
Immigrants from Moldova
Ethiopians
$91,446
MEDIAN HOUSEHOLD INCOME
98.3/ 100
METRIC RATING
101st/ 347
METRIC RANK
$89,640
MEDIAN HOUSEHOLD INCOME
94.9/ 100
METRIC RATING
121st/ 347
METRIC RANK
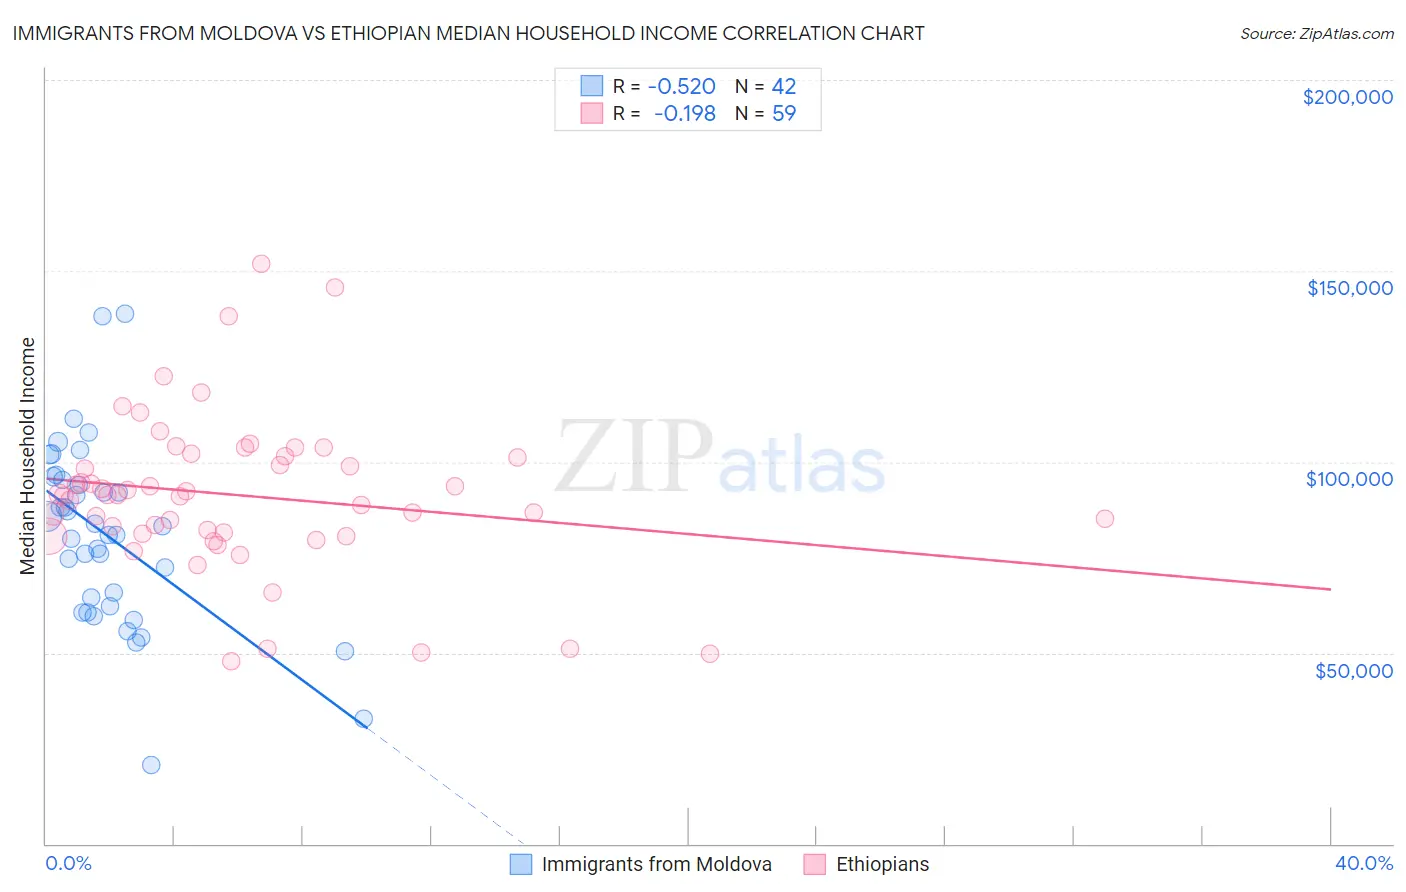
Immigrants from Moldova vs Ethiopian Median Household Income Correlation Chart
The statistical analysis conducted on geographies consisting of 124,363,535 people shows a substantial negative correlation between the proportion of Immigrants from Moldova and median household income in the United States with a correlation coefficient (R) of -0.520 and weighted average of $91,446. Similarly, the statistical analysis conducted on geographies consisting of 223,045,474 people shows a poor negative correlation between the proportion of Ethiopians and median household income in the United States with a correlation coefficient (R) of -0.198 and weighted average of $89,640, a difference of 2.0%.
Median Household Income Correlation Summary
| Measurement | Immigrants from Moldova | Ethiopian |
| Minimum | $20,699 | $47,668 |
| Maximum | $138,879 | $151,943 |
| Range | $118,180 | $104,275 |
| Mean | $80,883 | $91,215 |
| Median | $82,096 | $91,248 |
| Interquartile 25% (IQ1) | $62,083 | $81,124 |
| Interquartile 75% (IQ3) | $95,143 | $101,374 |
| Interquartile Range (IQR) | $33,060 | $20,250 |
| Standard Deviation (Sample) | $23,912 | $20,515 |
| Standard Deviation (Population) | $23,626 | $20,340 |
Demographics Similar to Immigrants from Moldova and Ethiopians by Median Household Income
In terms of median household income, the demographic groups most similar to Immigrants from Moldova are Austrian ($91,339, a difference of 0.12%), Immigrants from Ukraine ($91,124, a difference of 0.35%), Immigrants from Kazakhstan ($91,015, a difference of 0.47%), Immigrants from Brazil ($90,907, a difference of 0.59%), and Macedonian ($90,761, a difference of 0.75%). Similarly, the demographic groups most similar to Ethiopians are Immigrants from North Macedonia ($89,741, a difference of 0.11%), Albanian ($89,744, a difference of 0.12%), Syrian ($89,830, a difference of 0.21%), Taiwanese ($89,900, a difference of 0.29%), and Native Hawaiian ($89,919, a difference of 0.31%).
| Demographics | Rating | Rank | Median Household Income |
| Immigrants | Moldova | 98.3 /100 | #101 | Exceptional $91,446 |
| Austrians | 98.2 /100 | #102 | Exceptional $91,339 |
| Immigrants | Ukraine | 98.0 /100 | #103 | Exceptional $91,124 |
| Immigrants | Kazakhstan | 97.8 /100 | #104 | Exceptional $91,015 |
| Immigrants | Brazil | 97.7 /100 | #105 | Exceptional $90,907 |
| Macedonians | 97.4 /100 | #106 | Exceptional $90,761 |
| Croatians | 97.3 /100 | #107 | Exceptional $90,685 |
| Zimbabweans | 97.2 /100 | #108 | Exceptional $90,618 |
| Chileans | 97.2 /100 | #109 | Exceptional $90,605 |
| Palestinians | 97.1 /100 | #110 | Exceptional $90,574 |
| Immigrants | Poland | 97.1 /100 | #111 | Exceptional $90,549 |
| Northern Europeans | 96.9 /100 | #112 | Exceptional $90,446 |
| Peruvians | 96.5 /100 | #113 | Exceptional $90,261 |
| Immigrants | Northern Africa | 95.9 /100 | #114 | Exceptional $90,026 |
| Immigrants | Western Asia | 95.9 /100 | #115 | Exceptional $90,005 |
| Native Hawaiians | 95.7 /100 | #116 | Exceptional $89,919 |
| Taiwanese | 95.6 /100 | #117 | Exceptional $89,900 |
| Syrians | 95.4 /100 | #118 | Exceptional $89,830 |
| Albanians | 95.2 /100 | #119 | Exceptional $89,744 |
| Immigrants | North Macedonia | 95.2 /100 | #120 | Exceptional $89,741 |
| Ethiopians | 94.9 /100 | #121 | Exceptional $89,640 |