Immigrants from Moldova vs Arab Householder Income Over 65 years
COMPARE
Immigrants from Moldova
Arab
Householder Income Over 65 years
Householder Income Over 65 years Comparison
Immigrants from Moldova
Arabs
$62,939
HOUSEHOLDER INCOME OVER 65 YEARS
88.7/ 100
METRIC RATING
122nd/ 347
METRIC RANK
$62,266
HOUSEHOLDER INCOME OVER 65 YEARS
79.6/ 100
METRIC RATING
140th/ 347
METRIC RANK
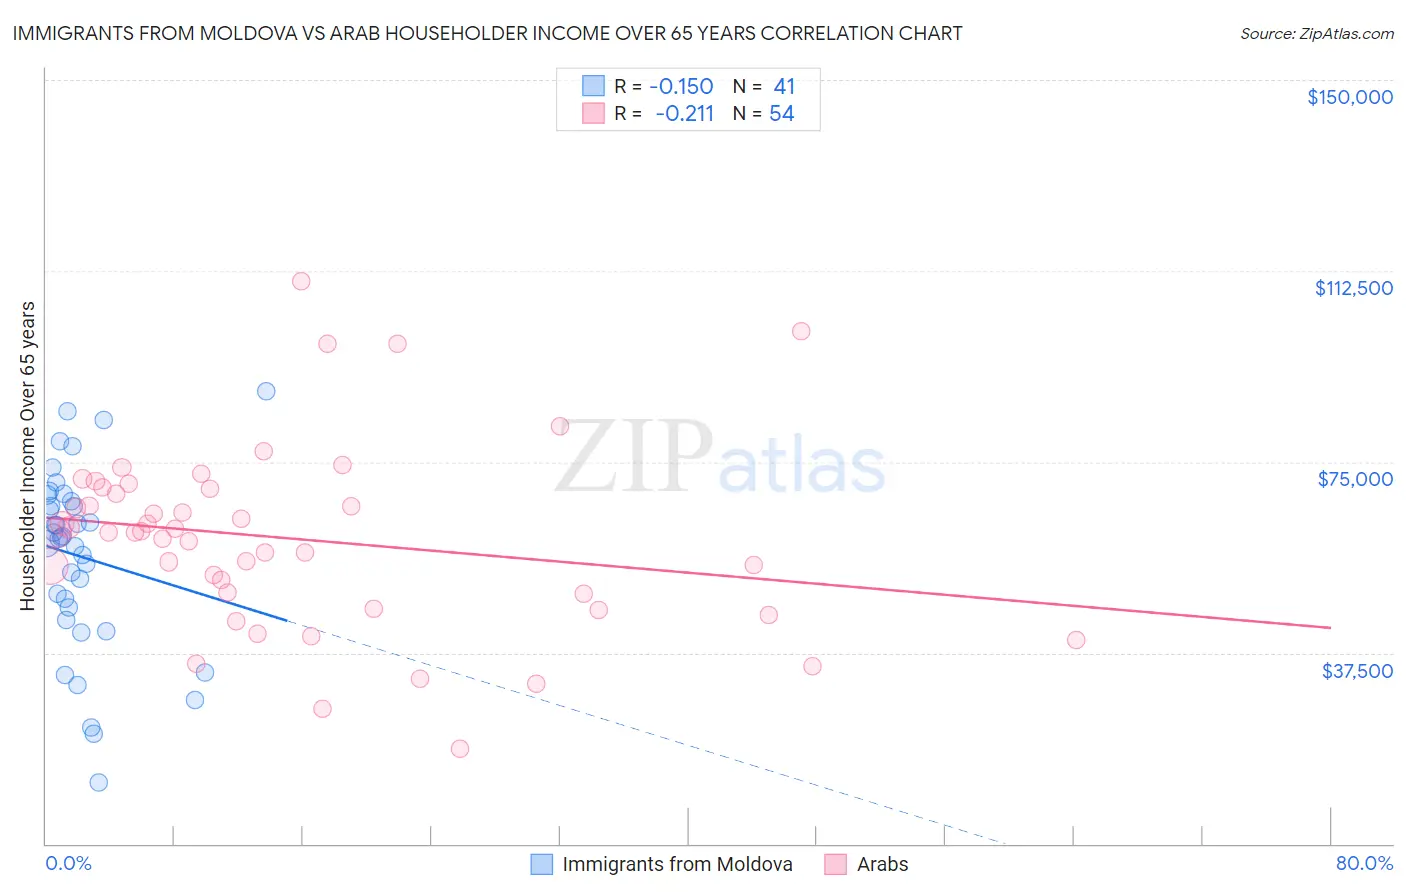
Immigrants from Moldova vs Arab Householder Income Over 65 years Correlation Chart
The statistical analysis conducted on geographies consisting of 124,248,392 people shows a poor negative correlation between the proportion of Immigrants from Moldova and household income with householder over the age of 65 in the United States with a correlation coefficient (R) of -0.150 and weighted average of $62,939. Similarly, the statistical analysis conducted on geographies consisting of 484,580,257 people shows a weak negative correlation between the proportion of Arabs and household income with householder over the age of 65 in the United States with a correlation coefficient (R) of -0.211 and weighted average of $62,266, a difference of 1.1%.
Householder Income Over 65 years Correlation Summary
| Measurement | Immigrants from Moldova | Arab |
| Minimum | $12,021 | $18,625 |
| Maximum | $88,833 | $110,553 |
| Range | $76,812 | $91,928 |
| Mean | $56,381 | $59,915 |
| Median | $60,083 | $61,186 |
| Interquartile 25% (IQ1) | $45,078 | $48,984 |
| Interquartile 75% (IQ3) | $67,835 | $69,644 |
| Interquartile Range (IQR) | $22,757 | $20,660 |
| Standard Deviation (Sample) | $17,894 | $18,146 |
| Standard Deviation (Population) | $17,674 | $17,978 |
Demographics Similar to Immigrants from Moldova and Arabs by Householder Income Over 65 years
In terms of householder income over 65 years, the demographic groups most similar to Immigrants from Moldova are Tlingit-Haida ($62,922, a difference of 0.030%), Taiwanese ($62,894, a difference of 0.070%), Immigrants from Vietnam ($63,014, a difference of 0.12%), Soviet Union ($62,848, a difference of 0.14%), and Peruvian ($62,766, a difference of 0.28%). Similarly, the demographic groups most similar to Arabs are Lebanese ($62,287, a difference of 0.030%), Immigrants from Kazakhstan ($62,292, a difference of 0.040%), Immigrants from Syria ($62,303, a difference of 0.060%), Canadian ($62,230, a difference of 0.060%), and Alaskan Athabascan ($62,330, a difference of 0.10%).
| Demographics | Rating | Rank | Householder Income Over 65 years |
| Immigrants | Vietnam | 89.5 /100 | #121 | Excellent $63,014 |
| Immigrants | Moldova | 88.7 /100 | #122 | Excellent $62,939 |
| Tlingit-Haida | 88.6 /100 | #123 | Excellent $62,922 |
| Taiwanese | 88.3 /100 | #124 | Excellent $62,894 |
| Soviet Union | 87.8 /100 | #125 | Excellent $62,848 |
| Peruvians | 86.8 /100 | #126 | Excellent $62,766 |
| Swedes | 86.4 /100 | #127 | Excellent $62,736 |
| Aleuts | 86.1 /100 | #128 | Excellent $62,708 |
| Immigrants | Eastern Europe | 85.9 /100 | #129 | Excellent $62,693 |
| Basques | 85.4 /100 | #130 | Excellent $62,653 |
| Immigrants | Western Asia | 85.3 /100 | #131 | Excellent $62,645 |
| Immigrants | Germany | 83.9 /100 | #132 | Excellent $62,544 |
| Immigrants | Northern Africa | 83.6 /100 | #133 | Excellent $62,522 |
| Immigrants | Brazil | 81.2 /100 | #134 | Excellent $62,364 |
| Immigrants | Chile | 81.0 /100 | #135 | Excellent $62,354 |
| Alaskan Athabascans | 80.6 /100 | #136 | Excellent $62,330 |
| Immigrants | Syria | 80.2 /100 | #137 | Excellent $62,303 |
| Immigrants | Kazakhstan | 80.0 /100 | #138 | Excellent $62,292 |
| Lebanese | 79.9 /100 | #139 | Good $62,287 |
| Arabs | 79.6 /100 | #140 | Good $62,266 |
| Canadians | 79.0 /100 | #141 | Good $62,230 |