Immigrants from Liberia vs Iraqi Median Earnings
COMPARE
Immigrants from Liberia
Iraqi
Median Earnings
Median Earnings Comparison
Immigrants from Liberia
Iraqis
$42,923
MEDIAN EARNINGS
0.7/ 100
METRIC RATING
264th/ 347
METRIC RANK
$46,140
MEDIAN EARNINGS
39.9/ 100
METRIC RATING
187th/ 347
METRIC RANK
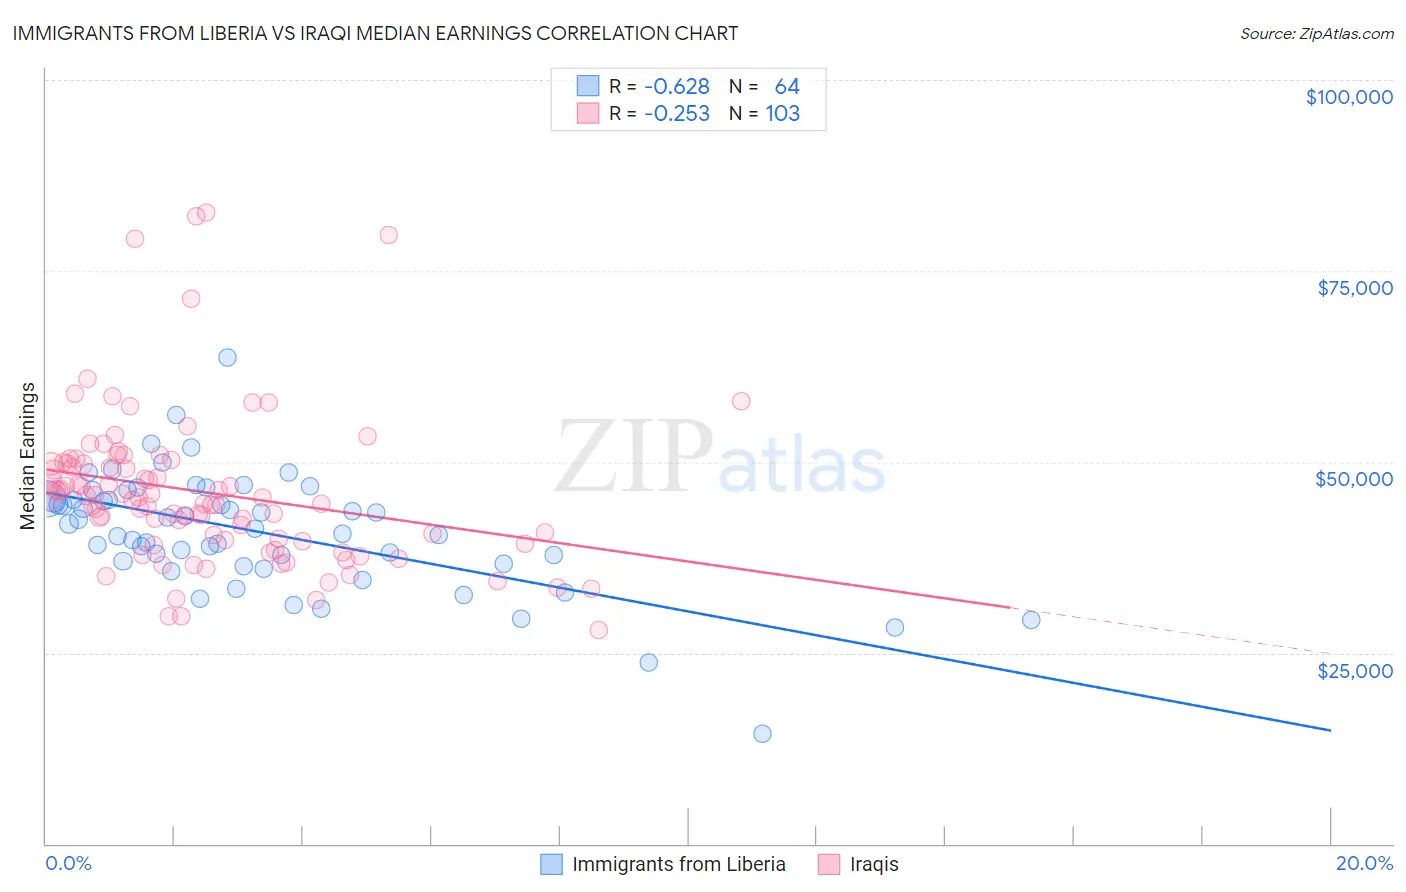
Immigrants from Liberia vs Iraqi Median Earnings Correlation Chart
The statistical analysis conducted on geographies consisting of 135,295,960 people shows a significant negative correlation between the proportion of Immigrants from Liberia and median earnings in the United States with a correlation coefficient (R) of -0.628 and weighted average of $42,923. Similarly, the statistical analysis conducted on geographies consisting of 170,634,576 people shows a weak negative correlation between the proportion of Iraqis and median earnings in the United States with a correlation coefficient (R) of -0.253 and weighted average of $46,140, a difference of 7.5%.
Median Earnings Correlation Summary
| Measurement | Immigrants from Liberia | Iraqi |
| Minimum | $14,336 | $27,932 |
| Maximum | $63,608 | $82,727 |
| Range | $49,272 | $54,795 |
| Mean | $40,857 | $46,064 |
| Median | $41,575 | $45,313 |
| Interquartile 25% (IQ1) | $36,787 | $39,685 |
| Interquartile 75% (IQ3) | $45,056 | $49,745 |
| Interquartile Range (IQR) | $8,269 | $10,060 |
| Standard Deviation (Sample) | $7,722 | $10,188 |
| Standard Deviation (Population) | $7,661 | $10,138 |
Similar Demographics by Median Earnings
Demographics Similar to Immigrants from Liberia by Median Earnings
In terms of median earnings, the demographic groups most similar to Immigrants from Liberia are Salvadoran ($42,912, a difference of 0.030%), Immigrants from Laos ($42,884, a difference of 0.090%), Inupiat ($43,000, a difference of 0.18%), Immigrants from Jamaica ($43,026, a difference of 0.24%), and Nicaraguan ($43,026, a difference of 0.24%).
| Demographics | Rating | Rank | Median Earnings |
| Jamaicans | 1.3 /100 | #257 | Tragic $43,343 |
| French American Indians | 1.3 /100 | #258 | Tragic $43,333 |
| German Russians | 1.1 /100 | #259 | Tragic $43,200 |
| Immigrants | Somalia | 0.9 /100 | #260 | Tragic $43,100 |
| Immigrants | Jamaica | 0.8 /100 | #261 | Tragic $43,026 |
| Nicaraguans | 0.8 /100 | #262 | Tragic $43,026 |
| Inupiat | 0.8 /100 | #263 | Tragic $43,000 |
| Immigrants | Liberia | 0.7 /100 | #264 | Tragic $42,923 |
| Salvadorans | 0.7 /100 | #265 | Tragic $42,912 |
| Immigrants | Laos | 0.7 /100 | #266 | Tragic $42,884 |
| Cree | 0.6 /100 | #267 | Tragic $42,777 |
| Americans | 0.6 /100 | #268 | Tragic $42,742 |
| Belizeans | 0.5 /100 | #269 | Tragic $42,702 |
| Osage | 0.5 /100 | #270 | Tragic $42,651 |
| Pennsylvania Germans | 0.5 /100 | #271 | Tragic $42,615 |
Demographics Similar to Iraqis by Median Earnings
In terms of median earnings, the demographic groups most similar to Iraqis are Vietnamese ($46,172, a difference of 0.070%), Immigrants from Armenia ($46,094, a difference of 0.10%), Uruguayan ($46,190, a difference of 0.11%), Immigrants from Kenya ($46,214, a difference of 0.16%), and Spaniard ($46,059, a difference of 0.18%).
| Demographics | Rating | Rank | Median Earnings |
| Puget Sound Salish | 46.5 /100 | #180 | Average $46,333 |
| Immigrants | Cameroon | 46.4 /100 | #181 | Average $46,329 |
| Swiss | 45.9 /100 | #182 | Average $46,315 |
| French | 45.2 /100 | #183 | Average $46,296 |
| Immigrants | Kenya | 42.4 /100 | #184 | Average $46,214 |
| Uruguayans | 41.6 /100 | #185 | Average $46,190 |
| Vietnamese | 40.9 /100 | #186 | Average $46,172 |
| Iraqis | 39.9 /100 | #187 | Fair $46,140 |
| Immigrants | Armenia | 38.3 /100 | #188 | Fair $46,094 |
| Spaniards | 37.2 /100 | #189 | Fair $46,059 |
| French Canadians | 36.1 /100 | #190 | Fair $46,026 |
| Finns | 33.4 /100 | #191 | Fair $45,940 |
| Germans | 33.2 /100 | #192 | Fair $45,935 |
| Guamanians/Chamorros | 33.2 /100 | #193 | Fair $45,933 |
| Immigrants | Costa Rica | 33.0 /100 | #194 | Fair $45,928 |