Immigrants from Laos vs Macedonian Householder Income Under 25 years

COMPARE

Immigrants from Laos
Race
Ancestry
AfghanAfricanAlaska NativeAlaskan AthabascanAlbanianAleutAlsatianAmericanApacheArabArapahoArgentineanArmenianAssyrian/Chaldean/SyriacAustralianAustrianBahamianBangladeshiBarbadianBasqueBelgianBelizeanBermudanBhutaneseBlackfeetBolivianBrazilianBritishBritish West IndianBulgarianBurmeseCajunCambodianCanadianCape VerdeanCarpatho RusynCelticCentral AmericanCentral American IndianCherokeeCheyenneChickasawChileanChineseChippewaChoctawColombianColvilleComancheCosta RicanCreeCreekCroatianCrowCubanCypriotCzechCzechoslovakianDanishDelawareDominicanDutchDutch West IndianEastern EuropeanEcuadorianEgyptianEnglishEstonianEthiopianEuropeanFijianFilipinoFinnishFrenchFrench American IndianFrench CanadianGermanGerman RussianGhanaianGreekGuamanian/ChamorroGuatemalanGuyaneseHaitianHmongHonduranHopiHoumaHungarianIcelanderIndian (Asian)IndonesianInupiatIranianIraqiIrishIroquoisIsraeliItalianJamaicanJapaneseJordanianKenyanKiowaKoreanLaotianLatvianLebaneseLiberianLithuanianLumbeeLuxembourgerMalaysianMalteseMarshalleseMenomineeMexicanMexican American IndianMongolianMoroccanNative HawaiianNavajoNepaleseNew ZealanderNicaraguanNigerianNorthern EuropeanNorwegianOkinawanOsageOttawaPaiutePakistaniPalestinianPanamanianParaguayanPennsylvania GermanPeruvianPimaPolishPortuguesePotawatomiPuebloPuerto RicanPuget Sound SalishRomanianRussianSalvadoranSamoanScandinavianScotch-IrishScottishSeminoleSenegaleseSerbianShoshoneSierra LeoneanSiouxSlavicSlovakSloveneSomaliSouth AfricanSouth AmericanSouth American IndianSoviet UnionSpaniardSpanishSpanish AmericanSpanish American IndianSri LankanSubsaharan AfricanSudaneseSwedishSwissSyrianTaiwaneseThaiTlingit-HaidaTohono O'OdhamTonganTrinidadian and TobagonianTsimshianTurkishU.S. Virgin IslanderUgandanUkrainianUruguayanUteVenezuelanVietnameseWelshWest IndianYakamaYaquiYugoslavianYumanYup'ikZimbabwean
Immigration
NonimmigrantsImmigrantsAfghanistanAfricaAlbaniaArgentinaArmeniaAsiaAustraliaAustriaBahamasBangladeshBarbadosBelarusBelgiumBelizeBoliviaBosnia and HerzegovinaBrazilBulgariaBurma/MyanmarCabo VerdeCambodiaCameroonCanadaCaribbeanCentral AmericaChileChinaColombiaCongoCosta RicaCroatiaCubaCzechoslovakiaDenmarkDominicaDominican RepublicEastern AfricaEastern AsiaEastern EuropeEcuadorEgyptEl SalvadorEnglandEritreaEthiopiaEuropeFijiFranceGermanyGhanaGreeceGrenadaGuatemalaGuyanaHaitiHondurasHong KongHungaryIndiaIndonesiaIranIraqIrelandIsraelItalyJamaicaJapanJordanKazakhstanKenyaKoreaKuwaitLaosLatin AmericaLatviaLebanonLiberiaLithuaniaMalaysiaMexicoMicronesiaMiddle AfricaMoldovaMoroccoNepalNetherlandsNicaraguaNigeriaNorth AmericaNorth MacedoniaNorthern AfricaNorthern EuropeNorwayOceaniaPakistanPanamaPeruPhilippinesPolandPortugalRomaniaRussiaSaudi ArabiaScotlandSenegalSerbiaSierra LeoneSingaporeSomaliaSouth AfricaSouth AmericaSouth Central AsiaSouth Eastern AsiaSouthern EuropeSpainSri LankaSt. Vincent and the GrenadinesSudanSwedenSwitzerlandSyriaTaiwanThailandTrinidad and TobagoTurkeyUgandaUkraineUruguayUzbekistanVenezuelaVietnamWest IndiesWestern AfricaWestern AsiaWestern EuropeYemenZaireZimbabweAzores
Macedonian
Race
Ancestry
AfghanAfricanAlaska NativeAlaskan AthabascanAlbanianAleutAlsatianAmericanApacheArabArapahoArgentineanArmenianAssyrian/Chaldean/SyriacAustralianAustrianBahamianBangladeshiBarbadianBasqueBelgianBelizeanBermudanBhutaneseBlackfeetBolivianBrazilianBritishBritish West IndianBulgarianBurmeseCajunCambodianCanadianCape VerdeanCarpatho RusynCelticCentral AmericanCentral American IndianCherokeeCheyenneChickasawChileanChineseChippewaChoctawColombianColvilleComancheCosta RicanCreeCreekCroatianCrowCubanCypriotCzechCzechoslovakianDanishDelawareDominicanDutchDutch West IndianEastern EuropeanEcuadorianEgyptianEnglishEstonianEthiopianEuropeanFijianFilipinoFinnishFrenchFrench American IndianFrench CanadianGermanGerman RussianGhanaianGreekGuamanian/ChamorroGuatemalanGuyaneseHaitianHmongHonduranHopiHoumaHungarianIcelanderIndian (Asian)IndonesianInupiatIranianIraqiIrishIroquoisIsraeliItalianJamaicanJapaneseJordanianKenyanKiowaKoreanLaotianLatvianLebaneseLiberianLithuanianLumbeeLuxembourgerMacedonianMalaysianMalteseMarshalleseMenomineeMexicanMexican American IndianMongolianMoroccanNative HawaiianNavajoNepaleseNew ZealanderNicaraguanNigerianNorthern EuropeanNorwegianOkinawanOsageOttawaPaiutePakistaniPalestinianPanamanianParaguayanPennsylvania GermanPeruvianPimaPolishPortuguesePotawatomiPuebloPuerto RicanPuget Sound SalishRomanianRussianSalvadoranSamoanScandinavianScotch-IrishScottishSeminoleSenegaleseSerbianShoshoneSierra LeoneanSiouxSlavicSlovakSloveneSomaliSouth AfricanSouth AmericanSouth American IndianSoviet UnionSpaniardSpanishSpanish AmericanSpanish American IndianSri LankanSubsaharan AfricanSudaneseSwedishSwissSyrianTaiwaneseThaiTlingit-HaidaTohono O'OdhamTonganTrinidadian and TobagonianTsimshianTurkishU.S. Virgin IslanderUgandanUkrainianUruguayanUteVenezuelanVietnameseWelshWest IndianYakamaYaquiYugoslavianYumanYup'ikZimbabwean
Immigration
NonimmigrantsImmigrantsAfghanistanAfricaAlbaniaArgentinaArmeniaAsiaAustraliaAustriaBahamasBangladeshBarbadosBelarusBelgiumBelizeBoliviaBosnia and HerzegovinaBrazilBulgariaBurma/MyanmarCabo VerdeCambodiaCameroonCanadaCaribbeanCentral AmericaChileChinaColombiaCongoCosta RicaCroatiaCubaCzechoslovakiaDenmarkDominicaDominican RepublicEastern AfricaEastern AsiaEastern EuropeEcuadorEgyptEl SalvadorEnglandEritreaEthiopiaEuropeFijiFranceGermanyGhanaGreeceGrenadaGuatemalaGuyanaHaitiHondurasHong KongHungaryIndiaIndonesiaIranIraqIrelandIsraelItalyJamaicaJapanJordanKazakhstanKenyaKoreaKuwaitLatin AmericaLatviaLebanonLiberiaLithuaniaMalaysiaMexicoMicronesiaMiddle AfricaMoldovaMoroccoNepalNetherlandsNicaraguaNigeriaNorth AmericaNorth MacedoniaNorthern AfricaNorthern EuropeNorwayOceaniaPakistanPanamaPeruPhilippinesPolandPortugalRomaniaRussiaSaudi ArabiaScotlandSenegalSerbiaSierra LeoneSingaporeSomaliaSouth AfricaSouth AmericaSouth Central AsiaSouth Eastern AsiaSouthern EuropeSpainSri LankaSt. Vincent and the GrenadinesSudanSwedenSwitzerlandSyriaTaiwanThailandTrinidad and TobagoTurkeyUgandaUkraineUruguayUzbekistanVenezuelaVietnamWest IndiesWestern AfricaWestern AsiaWestern EuropeYemenZaireZimbabweAzores
Householder Income Under 25 years
Income
Poverty
Unemployment
Labor Participation
Family Structure
Vehicle Availability
Education Level
Disability

Householder Income Under 25 years Comparison

Immigrants from Laos

Macedonians

Tragic
Exceptional
$50,041
HOUSEHOLDER INCOME UNDER 25 YEARS
0.5/ 100
METRIC RATING
267th/ 347
METRIC RANK
$54,563
HOUSEHOLDER INCOME UNDER 25 YEARS
99.7/ 100
METRIC RATING
73rd/ 347
METRIC RANK

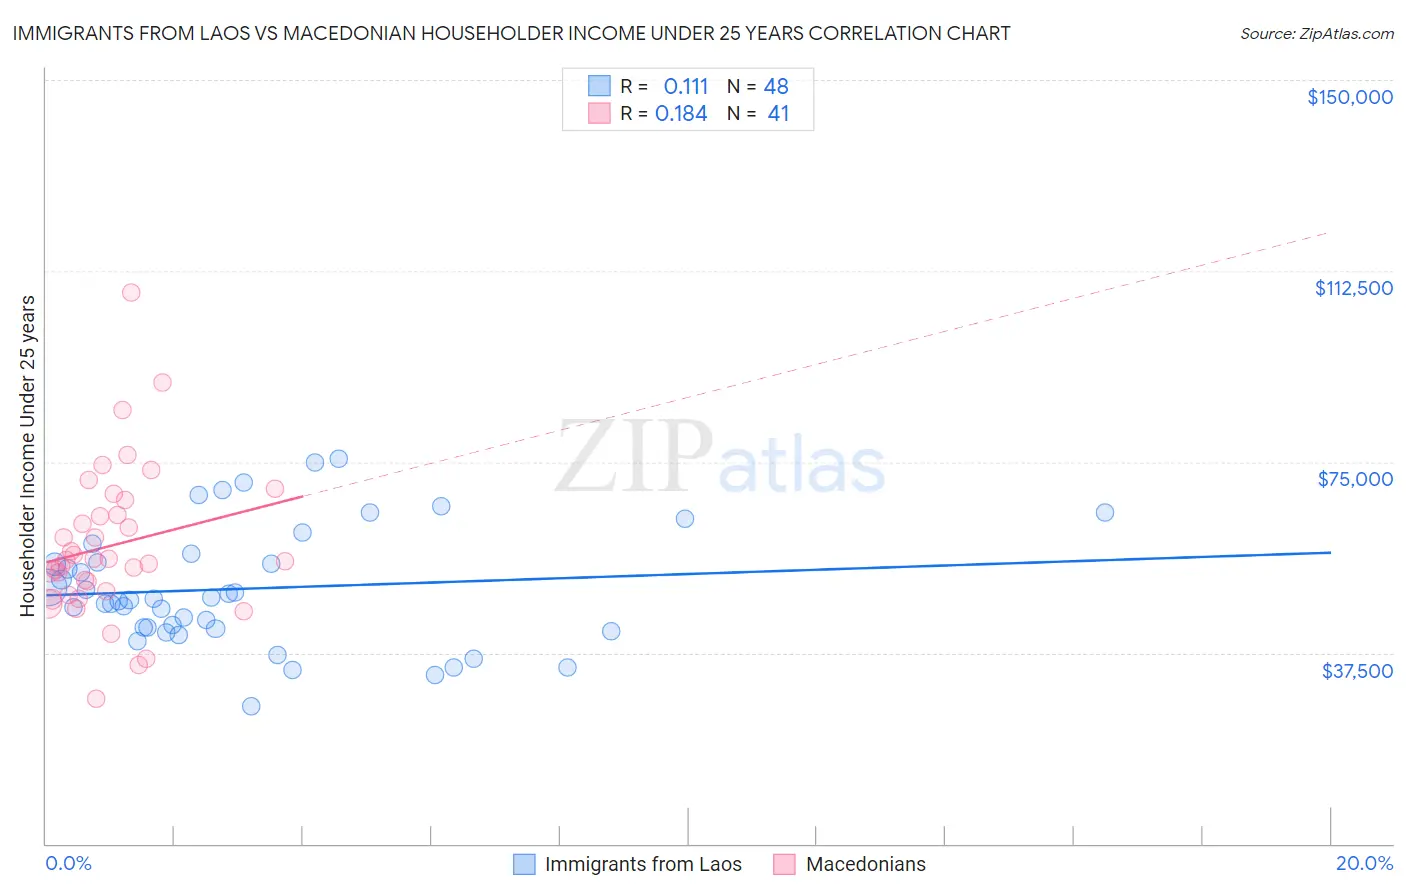
Immigrants from Laos vs Macedonian Householder Income Under 25 years Correlation Chart

The statistical analysis conducted on geographies consisting of 183,790,099 people shows a poor positive correlation between the proportion of Immigrants from Laos and household income with householder under the age of 25 in the United States with a correlation coefficient (R) of 0.111 and weighted average of $50,041. Similarly, the statistical analysis conducted on geographies consisting of 119,675,236 people shows a poor positive correlation between the proportion of Macedonians and household income with householder under the age of 25 in the United States with a correlation coefficient (R) of 0.184 and weighted average of $54,563, a difference of 9.0%.
Immigrants from Laos vs Macedonian Householder Income Under 25 years

Householder Income Under 25 years Correlation Summary

MeasurementImmigrants from LaosMacedonian
Minimum$27,039$28,544
Maximum$75,734$108,182
Range$48,695$79,638
Mean$50,097$58,519
Median$48,012$55,634
Interquartile 25% (IQ1)$42,252$49,194
Interquartile 75% (IQ3)$56,151$66,027
Interquartile Range (IQR)$13,899$16,833
Standard Deviation (Sample)$11,568$14,918
Standard Deviation (Population)$11,447$14,735

Similar Demographics by Householder Income Under 25 years

Demographics Similar to Immigrants from Laos by Householder Income Under 25 years

In terms of householder income under 25 years, the demographic groups most similar to Immigrants from Laos are Venezuelan ($50,011, a difference of 0.060%), Ute ($49,997, a difference of 0.090%), Mexican ($49,989, a difference of 0.10%), Belgian ($50,113, a difference of 0.14%), and Immigrants from Venezuela ($50,109, a difference of 0.14%).
DemographicsRating | RankHouseholder Income Under 25 years
Hispanics or Latinos
0.9
/100
|
#260
Tragic
$50,279
Hungarians
0.9
/100
|
#261
Tragic
$50,247
Haitians
0.8
/100
|
#262
Tragic
$50,231
Immigrants | Dominican Republic
0.8
/100
|
#263
Tragic
$50,204
Fijians
0.6
/100
|
#264
Tragic
$50,132
Belgians
0.6
/100
|
#265
Tragic
$50,113
Immigrants | Venezuela
0.6
/100
|
#266
Tragic
$50,109
Immigrants | Laos
0.5
/100
|
#267
Tragic
$50,041
Venezuelans
0.5
/100
|
#268
Tragic
$50,011
Ute
0.5
/100
|
#269
Tragic
$49,997
Mexicans
0.5
/100
|
#270
Tragic
$49,989
Taiwanese
0.3
/100
|
#271
Tragic
$49,804
Colville
0.3
/100
|
#272
Tragic
$49,774
Slovaks
0.3
/100
|
#273
Tragic
$49,753
Immigrants | Senegal
0.3
/100
|
#274
Tragic
$49,742

Demographics Similar to Macedonians by Householder Income Under 25 years

In terms of householder income under 25 years, the demographic groups most similar to Macedonians are Immigrants from Northern Europe ($54,571, a difference of 0.020%), Immigrants from Grenada ($54,538, a difference of 0.050%), Immigrants from Morocco ($54,593, a difference of 0.060%), Immigrants from El Salvador ($54,599, a difference of 0.070%), and Samoan ($54,610, a difference of 0.090%).
DemographicsRating | RankHouseholder Income Under 25 years
Immigrants | Bangladesh
99.8
/100
|
#66
Exceptional
$54,714
Okinawans
99.8
/100
|
#67
Exceptional
$54,701
Tsimshian
99.8
/100
|
#68
Exceptional
$54,649
Samoans
99.7
/100
|
#69
Exceptional
$54,610
Immigrants | El Salvador
99.7
/100
|
#70
Exceptional
$54,599
Immigrants | Morocco
99.7
/100
|
#71
Exceptional
$54,593
Immigrants | Northern Europe
99.7
/100
|
#72
Exceptional
$54,571
Macedonians
99.7
/100
|
#73
Exceptional
$54,563
Immigrants | Grenada
99.7
/100
|
#74
Exceptional
$54,538
Immigrants | Sri Lanka
99.7
/100
|
#75
Exceptional
$54,512
Immigrants | Brazil
99.6
/100
|
#76
Exceptional
$54,487
Immigrants | Southern Europe
99.6
/100
|
#77
Exceptional
$54,484
Nepalese
99.6
/100
|
#78
Exceptional
$54,472
Immigrants | Italy
99.6
/100
|
#79
Exceptional
$54,449
Egyptians
99.6
/100
|
#80
Exceptional
$54,444